Introduction to Japanese Candlestick Charts
Japanese candlestick charts are a popular and effective way to visualize and analyze price movements in financial markets, including forex. Developed in the 18th century by Japanese rice trader Munehisa Homma, these charts offer a more detailed and nuanced view of price action compared to traditional line charts.
Technical Analysis


Basic Structure of a Candlestick
A candlestick provides information about the price movements within a specific time period, such as one minute, one hour, or one day. Each candlestick consists of four main components:
Open Price: The price at which the asset started trading during the period.
Close Price: The price at which the asset finished trading during the period.
High Price: The highest price reached during the period.
Low Price: The lowest price reached during the period.
The candlestick is composed of two main parts:
Body: The thick part of the candlestick, which represents the range between the open and close prices.
Bullish Candle: When the close price is higher than the open price, indicating an upward movement. Typically, the body is colored green or white.
Bearish Candle: When the close price is lower than the open price, indicating a downward movement. Typically, the body is colored red or black.
Wicks (or Shadows): The thin lines above and below the body, representing the high and low prices during the period. The upper wick extends from the top of the body to the high price, and the lower wick extends from the bottom of the body to the low price.
Interpreting Candlesticks
Long Body: Indicates strong buying or selling pressure.
Long green (bullish) body: Buyers dominated the session.
Long red (bearish) body: Sellers dominated the session.
Short Body: Indicates consolidation or indecision.
Short green or red body: Little price movement between the open and close prices.
Long Upper Wick: Indicates that buyers pushed prices higher but sellers drove prices back down.
Long Lower Wick: Indicates that sellers pushed prices lower but buyers drove prices back up..
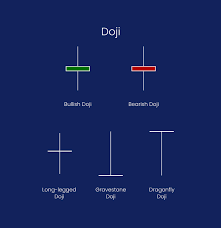
Doji
Description: A candlestick with a very small body, where the open and close prices are almost equal, indicating indecision in the market.
Types:
Standard Doji: Neutral pattern indicating indecision.
Gravestone Doji: Bearish reversal pattern with a long upper wick.
Dragonfly Doji: Bullish reversal pattern with a long lower wick.
Candlestick Pattern

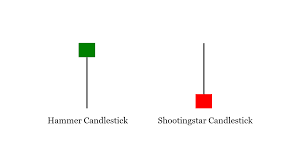

Hammer
Description: A bullish reversal pattern with a small body at the upper end of the trading range and a long lower wick. It forms after a downtrend.
Significance: Indicates potential reversal from a downtrend to an uptrend, suggesting buyers are stepping in.
Shooting Star
Description: A bearish reversal pattern with a small body at the lower end of the trading range and a long upper wick. It forms after an uptrend.
Significance: Indicates potential reversal from an uptrend to a downtrend, suggesting sellers are stepping in.

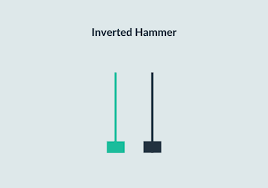
Inverted Hammer
Description: A bullish reversal pattern with a small body at the lower end of the trading range and a long upper wick. It forms after a downtrend.
Significance: Indicates potential reversal from a downtrend to an uptrend, suggesting buyers are stepping in despite initial selling pressure
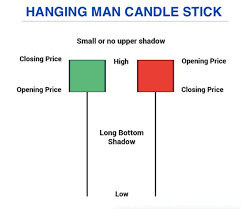

Hanging Man
Description: A bearish reversal pattern similar in appearance to the hammer, but it forms after an uptrend.
Significance: Indicates potential reversal from an uptrend to a downtrend, suggesting sellers are gaining strength.
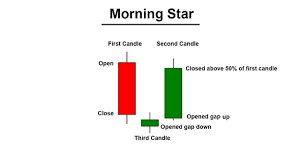

Morning Star
Description: A bullish reversal pattern consisting of three candlesticks:
A long bearish candlestick.
A small-bodied candlestick (indicating indecision).
A long bullish candlestick.
Significance: Indicates potential reversal from a downtrend to an uptrend, suggesting a shift from selling to buying pressure.
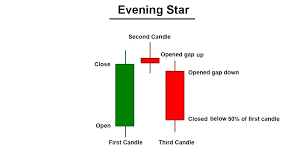

Evening Star
Description: A bearish reversal pattern consisting of three candlesticks:
A long bullish candlestick.
A small-bodied candlestick (indicating indecision).
A long bearish candlestick.
Significance: Indicates potential reversal from an uptrend to a downtrend, suggesting a shift from buying to selling pressure.
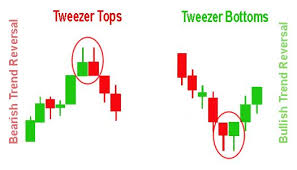

Tweezer Bottom
Description: A bullish reversal pattern consisting of two candlesticks with similar low prices:
A bearish candlestick followed by a bullish candlestick.
Significance: Indicates potential reversal from a downtrend to an uptrend, suggesting strong support at the lows.
Tweezer Top
Description: A bearish reversal pattern consisting of two candlesticks with similar high prices:
A bullish candlestick followed by a bearish candlestick.
Significance: Indicates potential reversal from an uptrend to a downtrend, suggesting strong resistance at the highs.
Engulfing Pattern
The engulfing candle pattern is a popular candlestick pattern used in technical analysis to identify potential reversals in the market. It consists of two candles and can be either bullish or bearish.
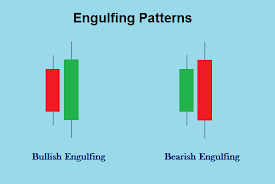

Bullish Engulfing Pattern
Characteristics:
First Candle: A smaller bearish (red) candle.
Second Candle: A larger bullish (green) candle that completely engulfs the body of the first candle.
Implications:
Trend Reversal: It usually appears at the end of a downtrend, signaling a potential reversal to an uptrend.
Market Sentiment: Indicates a shift in market sentiment from bearish to bullish.
Bearish Engulfing Pattern
Characteristics:
First Candle: A smaller bullish (green) candle.
Second Candle: A larger bearish (red) candle that completely engulfs the body of the first candle.
Implications:
Trend Reversal: It usually appears at the end of an uptrend, signaling a potential reversal to a downtrend.
Market Sentiment: Indicates a shift in market sentiment from bullish to bearish.
Practical Application
When analyzing these patterns, consider the following tips:
Confirm with Volume: Higher volume during the formation of these patterns can strengthen the signal.
Context Matters: Look at the overall trend and support/resistance levels for better accuracy.
Combine with Other Indicators: Use additional technical indicators (like RSI, MACD, moving averages) to confirm the patterns.
Practice: Use demo accounts to practice identifying and trading based on these patterns.
Understanding these candlestick patterns can significantly enhance your trading strategy by providing insights into potential market reversals and continuations.