Trendlines
Trendlines are straight lines drawn on a chart to connect a series of prices. They help traders identify the direction of the market trend. There are two main types of trendlines:
Uptrend Line
Downtrend Line
Trendlines And Channels
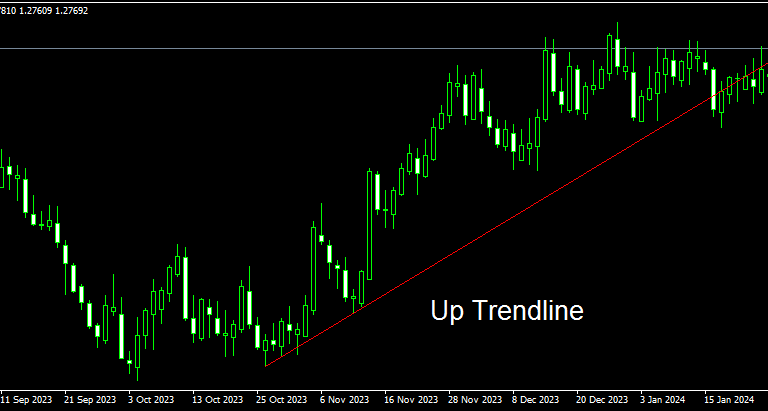
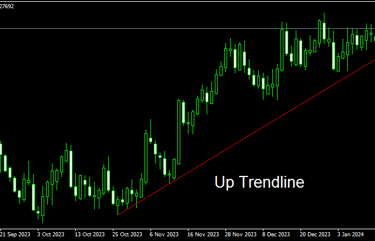
Uptrend Line
An uptrend line is drawn by connecting the lows of a rising price series. Each subsequent low should be higher than the previous low, creating a positive slope. This line acts as a support level, indicating that the market is trending upward.
How to Draw: Identify two or more consecutive higher lows and draw a line connecting them. Extend the line into the future to anticipate where the price might find support.
Downtrend Line
A downtrend line is drawn by connecting the highs of a falling price series. Each subsequent high should be lower than the previous high, creating a negative slope. This line acts as a resistance level, indicating that the market is trending downward.
How to Draw: Identify two or more consecutive lower highs and draw a line connecting them. Extend the line into the future to anticipate where the price might face resistance.


Channels
Channels are formed when two parallel trendlines are drawn to contain price action within them. Channels help traders visualize the range within which a security's price is oscillating. There are three types of channels:
Ascending Channel
Descending Channel
Horizontal Channel
Channels
Ascending Channel:
This channel is formed by drawing two upward sloping parallel lines around a price series. The lower line acts as support, and the upper line acts as resistance. This indicates a bullish trend.
How to Draw: Draw an uptrend line connecting the higher lows and a parallel line connecting the higher highs.
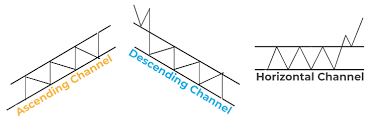
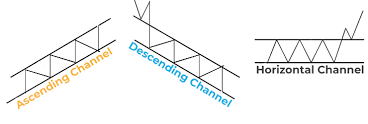
Descending Channel:
This channel is formed by drawing two downward sloping parallel lines around a price series. The upper line acts as resistance, and the lower line acts as support. This indicates a bearish trend.
How to Draw: Draw a downtrend line connecting the lower highs and a parallel line connecting the lower lows.
Horizontal Channel (or Range):
This channel is formed by drawing two horizontal parallel lines around a price series that moves sideways. The lower line acts as support, and the upper line acts as resistance. This indicates a period of consolidation without a clear trend.
How to Draw: Draw a horizontal line connecting the lows and a parallel horizontal line connecting the highs within the price range.
Applications in Trading
Identifying Trends: Trendlines and channels help traders identify whether the market is in an uptrend, downtrend, or sideways movement.
Support and Resistance: These tools help traders identify key support and resistance levels where the price is likely to bounce or reverse.
Entry and Exit Points: Trendlines and channels can be used to determine optimal entry and exit points for trades. For instance, traders might buy near the support trendline and sell near the resistance trendline in an ascending channel.
Trend Reversals: Breaking of trendlines or channels can signal potential trend reversals. For example, if the price breaks below an uptrend line, it may indicate the start of a downtrend.
By understanding and applying trendlines and channels, traders can enhance their ability to predict future price movements and make more informed trading decisions.
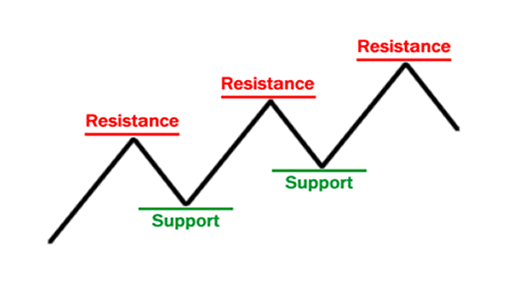
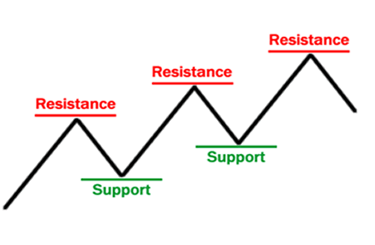
Support and Resistance
Support
Support is a price level where a downtrend can be expected to pause due to a concentration of demand. As the price of an asset drops to a support level, it becomes more attractive to buyers, causing demand to increase, which can prevent the price from falling further. If the price does break below support, it may indicate a bearish signal, suggesting that the downtrend will continue