Moving averages
Moving averages are a widely used technical analysis tool in trading that helps smooth out price data to identify the direction of a trend. They are particularly useful for filtering out the "noise" from random short-term price fluctuations. Here's a detailed look at moving averages:
Types of Moving Averages
Simple Moving Average (SMA)
Exponential Moving Average (EMA)
Weighted Moving Average (WMA)
Simple Moving Average (SMA)
The Simple Moving Average (SMA) is the arithmetic mean of a given set of prices over a specified number of periods.
Example: If you want to calculate the 5-day SMA of a stock, you sum the closing prices of the last 5 days and divide by 5.
Exponential Moving Average (EMA)
The Exponential Moving Average (EMA) gives more weight to recent prices, making it more responsive to new information compared to the SMA.
Example: To calculate the 10-day EMA, you start with the SMA of the first 10 days as the initial EMA, then apply the EMA formula for each subsequent price.
Weighted Moving Average (WMA)
The Weighted Moving Average (WMA) assigns different weights to each price, with more recent prices typically given greater weights.
Moving Averages
Identifying Trends
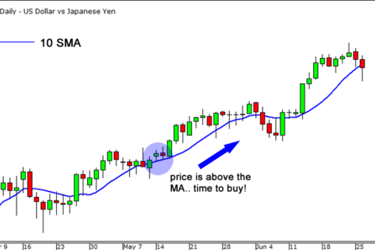
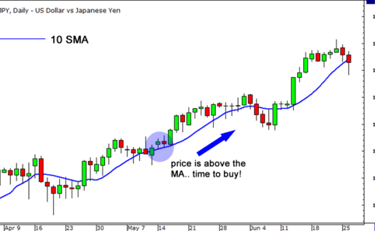
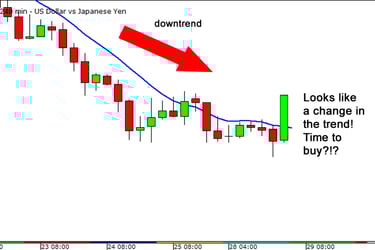
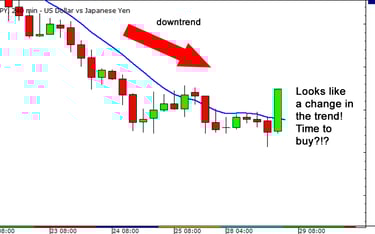
Moving averages help traders identify the direction of the trend. If the price is above the moving average, it's an uptrend, and if it's below, it's a downtrend.
Using Moving Averages to Trade
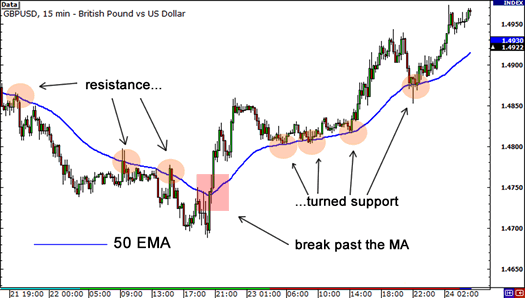
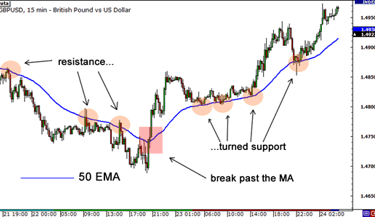
Using the 50 EMA as Dynamic Support and Resistance
Moving averages can act as dynamic support and resistance levels.
Using the 50-day Exponential Moving Average (50 EMA) as dynamic support is a common strategy among traders to identify potential buying opportunities during an uptrend. The 50 EMA, being more responsive to recent price changes than the Simple Moving Average (SMA), provides a smoother and more timely reflection of the price trend. Here’s how you can understand and utilize the 50 EMA as dynamic support
The moving average crossover
The moving average crossover strategy is a popular technical analysis method used by traders to identify potential trend reversals and generate trading signals. This strategy involves using two moving averages: a shorter-term moving average and a longer-term moving average. Here's an in-depth explanation of how moving average crossovers work and how to apply them:
Common Moving Averages Used in Crossovers
Short-term Moving Average: Often a 9-day or 20-day moving average.
Long-term Moving Average: Often a 50-day or 200-day moving average.
50 SMA and 200 SMA Crossover Signals
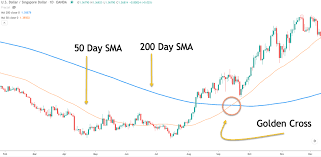
Golden Cross:
Bullish Signal: Occurs when the short-term moving average crosses above the long-term moving average.
Indicates the beginning of an uptrend or a continuation of an existing uptrend.
Example: 50-day SMA crossing above the 200-day SMA.

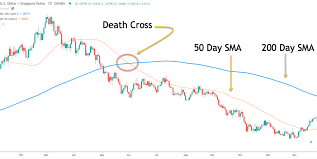
2.Death Cross:
Bearish Signal: Occurs when the short-term moving average crosses below the long-term moving average.
Indicates the beginning of a downtrend or a continuation of an existing downtrend.
Example: 50-day SMA crossing below the 200-day SMA.

How to Implement a Moving Average Crossover Strategy
Select Your Moving Averages:
Choose a short-term and a long-term moving average that fit your trading strategy and time frame. Common pairs are 9-day and 50-day, 20-day and 50-day, or 50-day and 200-day.
Plot the Moving Averages:
Use charting software to plot the chosen moving averages on your price chart.
Identify Crossover Points:
Monitor the chart for points where the short-term moving average crosses the long-term moving average.
Generate Trading Signals:
Golden Cross: Buy signal when the short-term MA crosses above the long-term MA.
Death Cross: Sell signal when the short-term MA crosses below the long-term MA.
Manage Your Trades:
Set stop-loss orders to manage risk.
Determine profit targets based on historical resistance levels or a favorable risk-reward ratio.