Chart patterns
Chart patterns are a cornerstone of technical analysis, offering traders insights into potential future price movements based on historical price action. Here are some of the most commonly used basic chart patterns
Double Top and Double Bottom
Triple Top and Triple Bottom
Head and Shoulders and Inverse Head and Shoulders
Bullish Flag and Bearish Flag
Bullish Penant and Bearish Penant
Ascending Triangle
Descending Triangle
Symmetrical Triangle
Bullish Rectangle and Bearish Rectangle
Chart patterns
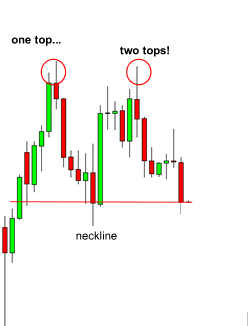
Double Top
A double top is a bearish reversal chart pattern that forms after a sustained uptrend and signals a potential change in trend direction. It consists of two peaks (or tops) at approximately the same price level, separated by a trough (or valley). Here’s a detailed explanation of the double top pattern.
Key Characteristics of a Double Top
Uptrend Preceding the Pattern:
The double top occurs after a notable upward price movement, indicating an established bullish trend.
First Peak (Top 1):
The price reaches a high point (Top 1) and then retreats as selling pressure increases.
Trough (Valley):
After the first peak, the price declines to a support level, forming a trough. This decline indicates a temporary weakness in the upward trend.
Second Peak (Top 2):
The price rallies again, reaching a similar high as the first peak (Top 2), but typically struggles to break above the previous high. This second peak indicates a resistance level.
Neckline:
The horizontal or slightly upward-sloping line that connects the troughs between the two peaks. The neckline acts as a support level.
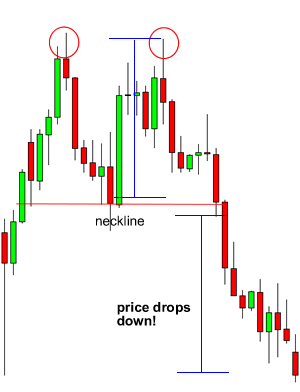
Breakdown:
The pattern is confirmed when the price breaks below the neckline after the formation of the second peak. This breakdown signals a bearish reversal.


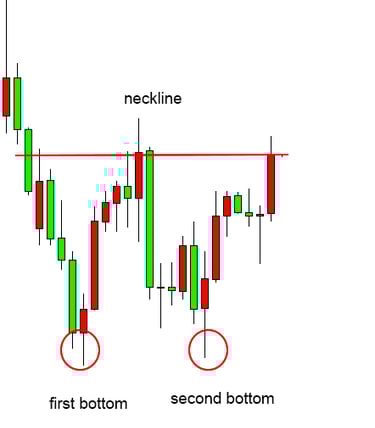
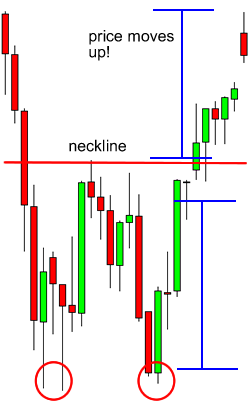
Double Bottom
A double bottom is a technical analysis chart pattern that signals a potential reversal in a downtrend. It is characterized by two distinct troughs (lows) at approximately the same price level, separated by a peak (high). This pattern indicates that the security is finding support at the bottom price level, suggesting that the downtrend might be ending and an upward trend could follow. The confirmation of the pattern occurs when the price breaks above the peak formed between the two bottoms.
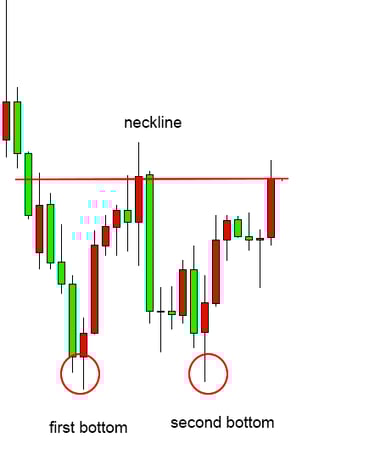
Entry Point
Confirmation of Breakout: Enter a long position when the price breaks above the peak formed between the two bottoms. This confirms that the downtrend is potentially reversing.
Stop-Loss (Exit) Point
Below Support Level: Place a stop-loss slightly below the lowest point of the double bottom to minimize losses if the pattern fails and the downtrend continues.
Take Profit Point
Measure the Height: Measure the vertical distance between the lowest point of the double bottom and the peak between the bottoms. Add this distance to the breakout point to set your take profit target.

Trading the Double Top Pattern
Identification:
Recognize the double top formation with two distinct peaks at approximately the same level, separated by a trough.
Entry Point:
Enter a short position when the price breaks below the neckline. Some traders wait for a retest of the neckline as resistance (formerly support) to confirm the breakdown.
Stop-Loss Placement:
Place a stop-loss order above the second peak (Top 2) to manage risk and protect against a false breakdown.
Profit Target:
Measure the vertical distance from the peaks to the neckline and project that distance downward from the neckline to set a profit target.
Triple Top and Triple Bottom
Triple Top
A triple top is a bearish technical analysis chart pattern that indicates a potential reversal of an uptrend. It consists of three peaks (highs) at approximately the same price level, with two intervening troughs (lows) between them. This pattern suggests that the asset has reached a resistance level that it is unable to surpass, signaling a possible upcoming downtrend. The confirmation of the pattern occurs when the price breaks below the support level formed by the lows between the peaks.
Triple Bottom
A triple bottom is a bullish technical analysis chart pattern that indicates a potential reversal of a downtrend. It consists of three troughs (lows) at approximately the same price level, with two intervening peaks (highs) between them. This pattern suggests that the asset has found a strong support level, signaling a possible upcoming uptrend. The confirmation of the pattern occurs when the price breaks above the resistance level formed by the highs between the troughs
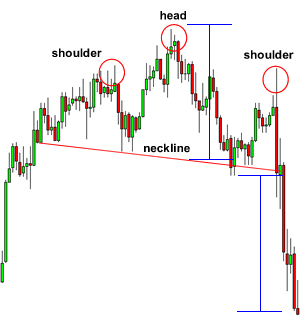
Head and Shoulders
The head and shoulders pattern is a bearish technical analysis chart pattern that signals a potential reversal from an uptrend to a downtrend. It consists of three peaks:
Left Shoulder: The first peak, followed by a decline.
Head: A higher peak than the left shoulder, followed by another decline.
Right Shoulder: A lower peak similar in height to the left shoulder.
The pattern is complete when the price breaks below the neckline, which is drawn by connecting the lows between the shoulders and the head. This break confirms the reversal, suggesting a potential downtrend.
Head & Shoulders and Inverse Head & Shoulders

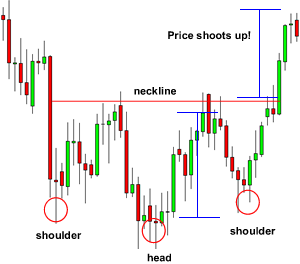
Inverse Head and Shoulders
The inverse head and shoulders pattern is a bullish technical analysis chart pattern that signals a potential reversal from a downtrend to an uptrend. It consists of three troughs:
Left Shoulder: The first low, followed by a rise.
Head: A lower low than the left shoulder, followed by another rise.
Right Shoulder: A higher low similar in depth to the left shoulder.
The pattern is complete when the price breaks above the neckline, which is drawn by connecting the highs between the shoulders and the head. This break confirms the reversal, suggesting a potential uptrend.

Key Points for Both Patterns
Neckline: The line connecting the highs (for head and shoulders) or the lows (for inverse head and shoulders) between the shoulders and the head.
Breakout Confirmation: The pattern is confirmed when the price breaks through the neckline.
Trading Strategy:
For head and shoulders: Enter a short position upon a break below the neckline.
For inverse head and shoulders: Enter a long position upon a break above the neckline.
Stop-Loss: Place a stop-loss above (head and shoulders) or below (inverse head and shoulders) the last shoulder to manage risk.
Take Profit: Measure the vertical distance from the head to the neckline and apply this distance from the breakout point to set the take profit target.
Bullish Flag
A bullish flag is a technical analysis chart pattern that signals a potential continuation of an uptrend. It consists of two main parts:
Flagpole: A strong, nearly vertical upward price movement, representing a significant rally.
Flag: A rectangular consolidation pattern that slopes slightly downward or moves sideways, indicating a brief pause or consolidation in the trend.
The bullish flag pattern is complete when the price breaks out above the upper boundary of the flag, signaling the continuation of the previous uptrend.
Flag Pattern
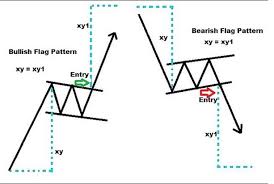

Bearish Flag
A bearish flag is a technical analysis chart pattern that signals a potential continuation of a downtrend. It also consists of two main parts:
Flagpole: A strong, nearly vertical downward price movement, representing a significant decline.
Flag: A rectangular consolidation pattern that slopes slightly upward or moves sideways, indicating a brief pause or consolidation in the trend.
The bearish flag pattern is complete when the price breaks out below the lower boundary of the flag, signaling the continuation of the previous downtrend.
Key Points for Both Patterns
Pattern Identification:
Look for a strong price movement (flagpole) followed by a consolidation phase (flag).
The flag usually has parallel trend lines.
Breakout Confirmation:
Bullish flag: Enter a long position upon a breakout above the upper boundary of the flag.
Bearish flag: Enter a short position upon a breakout below the lower boundary of the flag.
Stop-Loss:
For bullish flags, place a stop-loss below the lower boundary of the flag.
For bearish flags, place a stop-loss above the upper boundary of the flag.
Take Profit:
Measure the height of the flagpole and project it from the breakout point to set the take profit target.
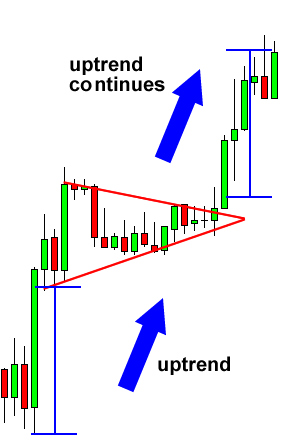
Bullish Pennant
A bullish pennant is a technical analysis chart pattern that signals a potential continuation of an uptrend. It consists of two main parts:
Flagpole: A strong, nearly vertical upward price movement, representing a significant rally.
Pennant: A small symmetrical triangle that forms as the price consolidates, characterized by converging trend lines that slope slightly downward or sideways.
The bullish pennant pattern is complete when the price breaks out above the upper boundary of the pennant, indicating the continuation of the previous uptrend.
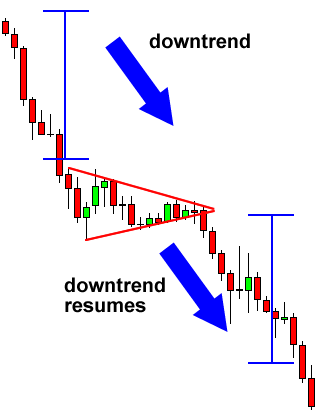
Penants
Bearish Pennant
A bearish pennant is a technical analysis chart pattern that signals a potential continuation of a downtrend. It also consists of two main parts:
Flagpole: A strong, nearly vertical downward price movement, representing a significant decline.
Pennant: A small symmetrical triangle that forms as the price consolidates, characterized by converging trend lines that slope slightly upward or sideways.
The bearish pennant pattern is complete when the price breaks out below the lower boundary of the pennant, indicating the continuation of the previous downtrend.
Key Points for Both Patterns
Pattern Identification:
Look for a strong price movement (flagpole) followed by a consolidation phase (pennant).
The pennant typically has converging trend lines, forming a symmetrical triangle.
Breakout Confirmation:
Bullish pennant: Enter a long position upon a breakout above the upper boundary of the pennant.
Bearish pennant: Enter a short position upon a breakout below the lower boundary of the pennant.
Stop-Loss:
For bullish pennants, place a stop-loss below the lower boundary of the pennant.
For bearish pennants, place a stop-loss above the upper boundary of the pennant.
Take Profit:
Measure the height of the flagpole and project it from the breakout point to set the take profit target.


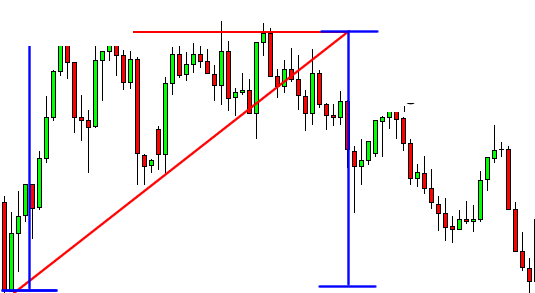
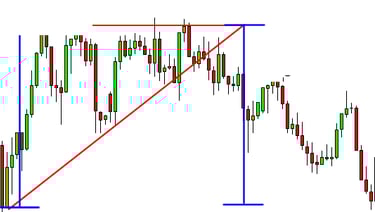
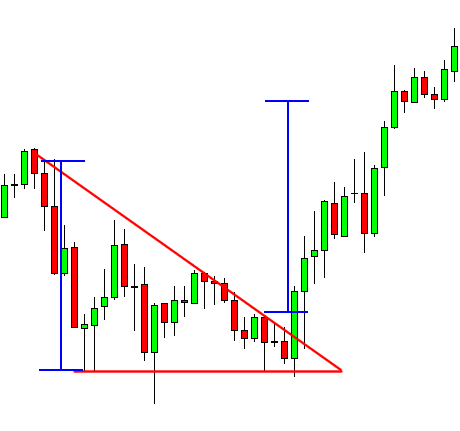
Ascending Triangle
An ascending triangle is a bullish technical analysis chart pattern that indicates a potential continuation of an uptrend or a possible reversal from a downtrend. It is characterized by a horizontal resistance line (top) and an upward sloping support line (bottom). The pattern forms as the price makes higher lows and repeatedly tests the resistance level, creating a shape that resembles a right-angled triangle.
Triangle Patterns
Key Characteristics
Resistance Line: A horizontal line connecting multiple highs at roughly the same price level.
Support Line: An upward sloping line connecting higher lows, indicating increasing buying pressure.
Volume: Typically, volume decreases during the formation of the pattern and then increases at the breakout.
Trading the Ascending Triangle
Pattern Identification:
Identify the horizontal resistance line by connecting at least two highs.
Identify the upward sloping support line by connecting at least two higher lows.
Breakout Confirmation:
The pattern is confirmed when the price breaks above the horizontal resistance line with increased volume.
Traders typically enter a long position upon this breakout.
Stop-Loss:
Place a stop-loss below the most recent low within the ascending triangle to manage risk in case of a false breakout.
Take Profit:
Measure the height of the triangle (the vertical distance between the initial high and the first low) and project this distance upward from the breakout point to set the take profit target.
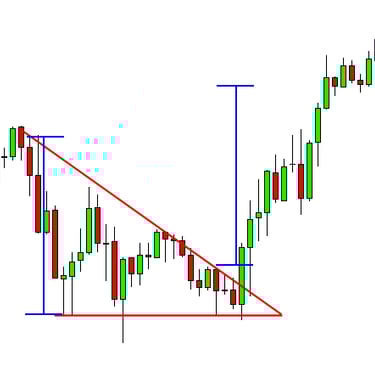
Descending Triangle
A descending triangle is a bearish technical analysis chart pattern that indicates a potential continuation of a downtrend or a possible reversal from an uptrend. It is characterized by a horizontal support line (bottom) and a downward sloping resistance line (top). The pattern forms as the price makes lower highs and repeatedly tests the support level, creating a shape that resembles a right-angled triangle.
Key Characteristics
Support Line: A horizontal line connecting multiple lows at roughly the same price level.
Resistance Line: A downward sloping line connecting lower highs, indicating increasing selling pressure.
Volume: Typically, volume decreases during the formation of the pattern and then increases at the breakout.
Trading the Descending Triangle
Pattern Identification:
Identify the horizontal support line by connecting at least two lows.
Identify the downward sloping resistance line by connecting at least two lower highs.
Breakout Confirmation:
The pattern is confirmed when the price breaks below the horizontal support line with increased volume.
Traders typically enter a short position upon this breakout.
Stop-Loss:
Place a stop-loss above the most recent high within the descending triangle to manage risk in case of a false breakout.
Take Profit:
Measure the height of the triangle (the vertical distance between the initial low and the first high) and project this distance downward from the breakout point to set the take profit target.
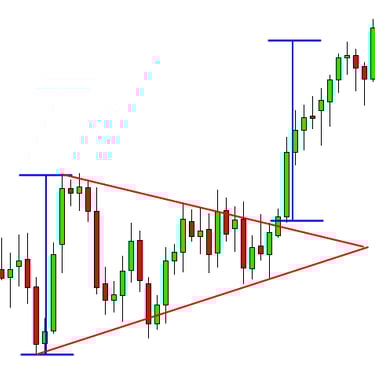
Symmetrical Triangle
A symmetrical triangle is a technical analysis chart pattern that indicates a period of consolidation before the price moves in the direction of the existing trend. It is characterized by converging trend lines, where the upper line slopes downward and the lower line slopes upward, forming a shape that resembles a triangle.
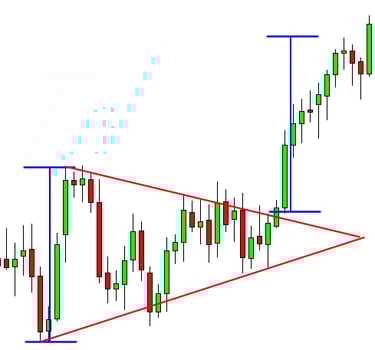
Key Characteristics
Converging Trend Lines: The upper trend line slopes downward, connecting lower highs, and the lower trend line slopes upward, connecting higher lows.
Volume: Typically, volume decreases during the formation of the pattern and then increases at the breakout.
Neutral Pattern: Unlike ascending or descending triangles, the symmetrical triangle is neutral and can signal either a continuation or a reversal of the existing trend, depending on the direction of the breakout.
Trading the Symmetrical Triangle
Pattern Identification:
Identify the upper trend line by connecting at least two lower highs.
Identify the lower trend line by connecting at least two higher lows.
Breakout Confirmation:
The pattern is confirmed when the price breaks out of the triangle, either above the upper trend line or below the lower trend line, with increased volume.
Traders typically enter a position in the direction of the breakout (long if upward, short if downward).
Stop-Loss:
Place a stop-loss just outside the opposite trend line to manage risk in case of a false breakout.
Take Profit:
Measure the height of the triangle at its widest point (the vertical distance between the initial high and low) and project this distance from the breakout point to set the take profit target.
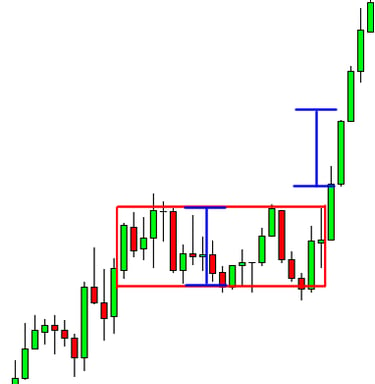
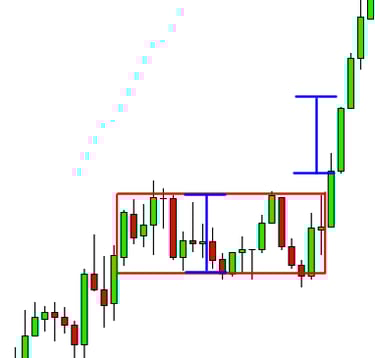
Bullish Rectangle
A bullish rectangle is a technical analysis chart pattern that signals a potential continuation of an uptrend. It is characterized by parallel horizontal trend lines, where the price moves within a range bounded by a support line at the bottom and a resistance line at the top. This pattern suggests that buyers and sellers are in a state of equilibrium, with neither side dominating, resulting in sideways price movement.
Rectangle Patterns
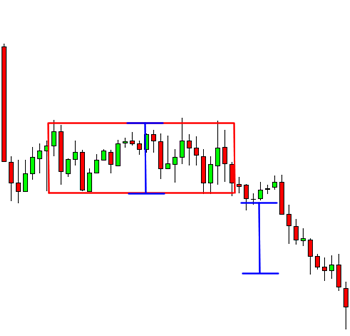
Bearish Rectangle
A bearish rectangle is the inverse of a bullish rectangle and signals a potential continuation of a downtrend. It has the same characteristics as a bullish rectangle but forms after a strong downward price movement, representing a period of consolidation before the downtrend resumes.
Key Characteristics
Horizontal Trend Lines: Both the support and resistance lines are parallel and horizontal.
Consolidation Phase: The pattern typically forms after a strong downward price movement, representing a period of consolidation before the downtrend resumes.
Volume: Volume tends to decrease during the formation of the rectangle and then increases upon the breakout.
Trading the Bearish Rectangle
Pattern Identification:
Identify the support line by connecting at least two lows.
Identify the resistance line by connecting at least two highs.
Breakout Confirmation:
The pattern is confirmed when the price breaks out below the support line with increased volume.
Traders typically enter a short position upon this breakout, expecting the downtrend to continue.
Stop-Loss:
Place a stop-loss just above the resistance line to manage risk in case of a false breakout.
Take Profit:
Measure the height of the rectangle (the vertical distance between the support and resistance lines) and project this distance downward from the breakout point to set the take profit target.
By following these steps, traders can effectively use bullish and bearish rectangle patterns to make informed trading decisions.

Key Characteristics
Horizontal Trend Lines: Both the support and resistance lines are parallel and horizontal.
Consolidation Phase: The pattern typically forms after a strong upward price movement, representing a period of consolidation before the uptrend resumes.
Volume: Volume tends to decrease during the formation of the rectangle and then increases upon the breakout.
Trading the Bullish Rectangle
Pattern Identification:
Identify the support line by connecting at least two lows.
Identify the resistance line by connecting at least two highs.
Breakout Confirmation:
The pattern is confirmed when the price breaks out above the resistance line with increased volume.
Traders typically enter a long position upon this breakout, expecting the uptrend to continue.
Stop-Loss:
Place a stop-loss just below the support line to manage risk in case of a false breakout.
Take Profit:
Measure the height of the rectangle (the vertical distance between the support and resistance lines) and project this distance upward from the breakout point to set the take profit target.