Fibonacci Trading
Fibonacci trading is a technical analysis approach that involves using Fibonacci ratios and Fibonacci retracement levels to identify potential support and resistance levels in financial markets. It is based on the Fibonacci sequence, a series of numbers where each number is the sum of the two preceding ones (e.g., 0, 1, 1, 2, 3, 5, 8, 13, 21, etc.).
Fibonacci Trading
Key Concepts in Fibonacci Trading:
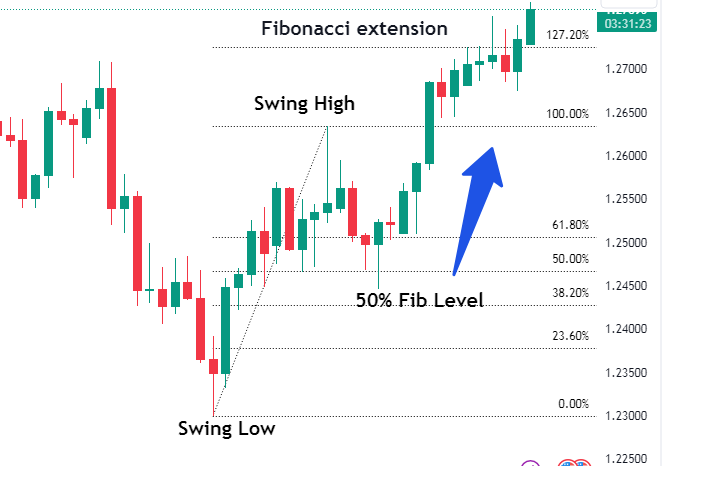
Fibonacci Retracement Levels: These levels are horizontal lines drawn on a chart to indicate potential areas of support or resistance. The key Fibonacci retracement levels are 23.6%, 38.2%, 50%, 61.8%, and 100%.
Fibonacci Extensions: These are additional levels beyond 100% that traders use to project potential price targets. Common Fibonacci extension levels include 127.2%, 161.8%, and 261.8%.
Example of Fibonacci Trading:
Identify a Trend: Determine whether the market is in an uptrend or downtrend.
Select Swing Points: Identify significant highs and lows to anchor Fibonacci retracement or extension levels.
Draw Fibonacci Levels: Draw Fibonacci retracement or extension levels from swing points to identify potential support, resistance, or price targets.
Analyze Price Action: Look for price reactions around Fibonacci levels, such as bounces, breaks, or reversals.
Trade Execution: Based on the analysis, decide whether to enter, exit, or manage trades accordingly.
Fibonacci trading is popular among technical analysts and traders due to its versatility and ability to provide potential price levels where market behavior may change. However, it's essential to combine Fibonacci analysis with other technical and fundamental factors for a comprehensive trading strategy.
How Fibonacci Trading Works:
Retracement: In an uptrend, traders use Fibonacci retracement levels to identify potential buying opportunities, considering areas of support. Conversely, in a downtrend, Fibonacci retracement levels can indicate potential selling opportunities, considering areas of resistance.
Extensions: Fibonacci extension levels are used to project potential price targets beyond the initial price movement. Traders may use these levels to set profit targets or identify where a trend might potentially reverse.
Confluence: Traders often look for confluence between Fibonacci levels and other technical indicators, such as moving averages, trendlines, or chart patterns, to increase the reliability of their trading signals.
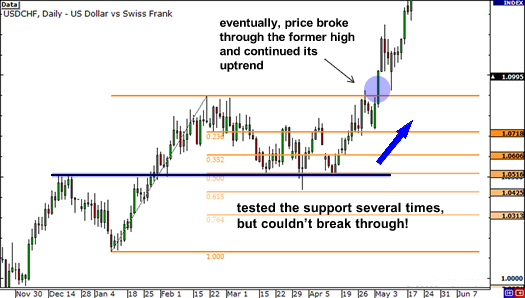
Combining Fibonacci with Support and Resistance:
Confluence Zones: Look for areas where Fibonacci retracement levels align with key support or resistance levels. These confluence zones indicate stronger potential reversal points or areas of interest for traders.
Confirmation: When Fibonacci retracement levels coincide with established support or resistance levels, it adds confirmation to the significance of those levels. Traders may give more weight to trades taken at these confluence zones.
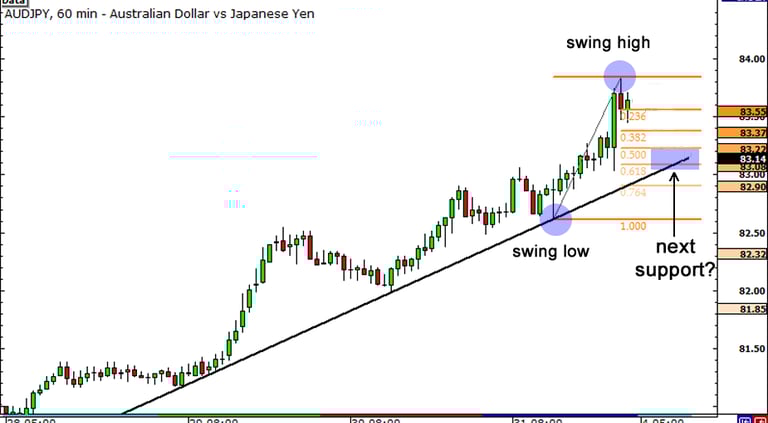
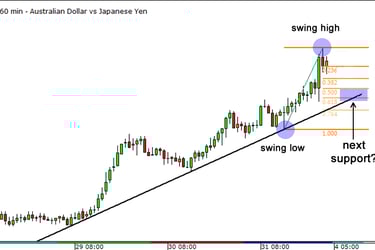
Combining Fibonacci Retracement Levels with Trend Lines:
Combining Fibonacci analysis with trend lines can provide traders with powerful insights into potential areas of support, resistance, and trend continuation. Here's how you can effectively use Fibonacci retracement levels in conjunction with trend lines:
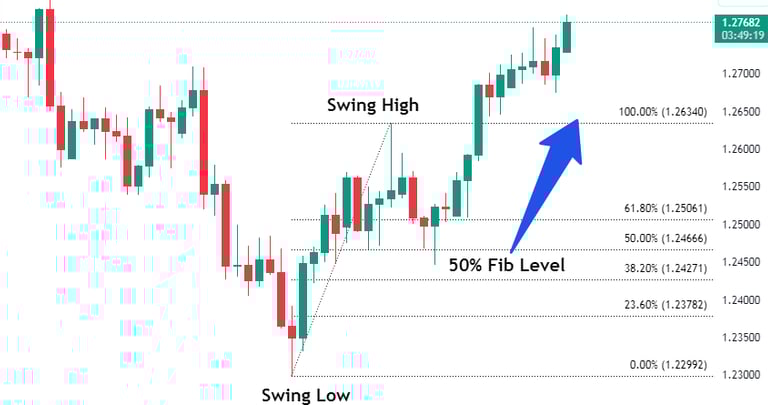
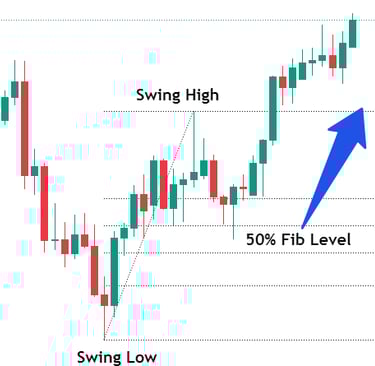
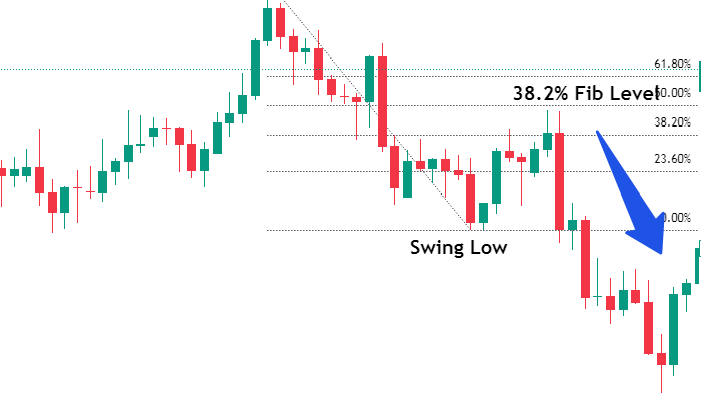
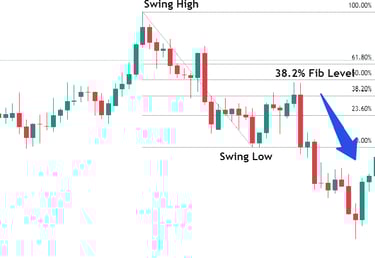
Identify the Trend:
Determine the direction of the trend by drawing trend lines connecting consecutive swing highs (downtrend) or swing lows (uptrend).
Anchor Fibonacci Retracement Levels:
Once the trend is identified, anchor Fibonacci retracement levels from the swing high to the swing low (in a downtrend) or from the swing low to the swing high (in an uptrend).
Combining Fibonacci analysis with candlestick patterns
Combining Fibonacci analysis with candlestick patterns can provide traders with comprehensive insights into potential entry and exit points in the market. Here's how you can effectively use Fibonacci retracement levels in conjunction with candlestick patterns.
Identify Fibonacci Retracement Levels:
Anchor Fibonacci retracement levels from significant swing highs to swing lows (in a downtrend) or swing lows to swing highs (in an uptrend).
Spot Candlestick Patterns:
Look for candlestick patterns that indicate potential reversals or continuation of the trend.
Common reversal candlestick patterns include engulfing patterns, hammers, shooting stars, and doji candles.
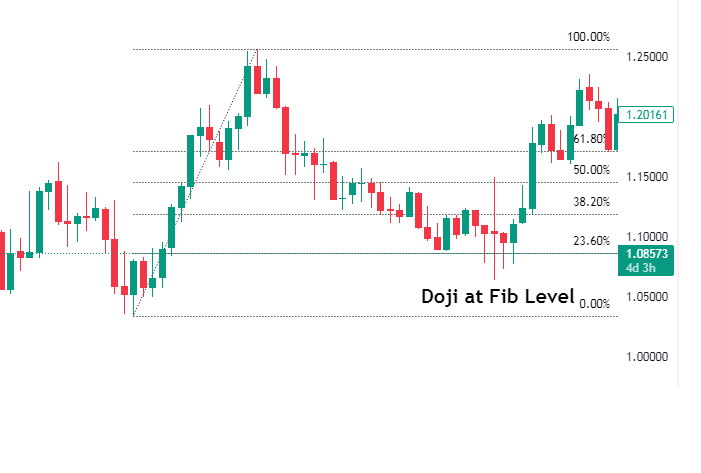
Combine Fibonacci Levels with Candlestick Patterns:
Look for confluence between Fibonacci retracement levels and candlestick patterns. When Fibonacci levels align with significant candlestick patterns, it strengthens the significance of those levels.
For example, if a bullish engulfing pattern forms at a Fibonacci retracement level (e.g., 50%) in an uptrend, it suggests potential bullish momentum.
Trading Strategies:
Confirmation Signals: Use candlestick patterns as confirmation signals to enter trades at Fibonacci retracement levels. For example, a bullish reversal candlestick pattern at a key Fibonacci support level in an uptrend may signal a potential long entry.
Combined Analysis: Combine Fibonacci levels, candlestick patterns, and other technical indicators to validate trade setups and increase the probability of successful trades.