Bollinger Bands
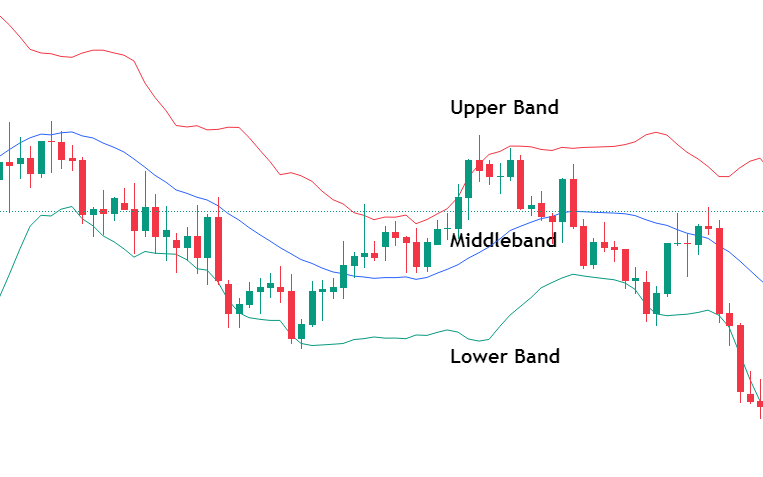
Description: Bollinger Bands are a technical analysis tool developed by John Bollinger in the 1980s. They consist of three lines plotted on a price chart:
Middle Band: This is a simple moving average (SMA), typically set to 20 periods.
Upper Band: This is calculated by adding twice the standard deviation to the middle band.
Lower Band: This is calculated by subtracting twice the standard deviation from the middle band.
The standard deviation is a measure of volatility, so the bands widen when the market is volatile and contract when the market is stable.
Calculation:
Middle Band (MB): 20-period SMA of the closing prices.
Upper Band (UB): MB + (2 * Standard Deviation)
Lower Band (LB): MB - (2 * Standard Deviation)
Usage
Bollinger Bands are used to analyze price volatility and identify potential trading opportunities based on the price's relationship with the bands. Here are some common strategies and uses:
1. Identifying Overbought and Oversold Conditions
Overbought: When the price touches or exceeds the upper band, it may be considered overbought. This could signal a potential sell opportunity.
Oversold: When the price touches or falls below the lower band, it may be considered oversold. This could signal a potential buy opportunity.
2. Volatility Analysis
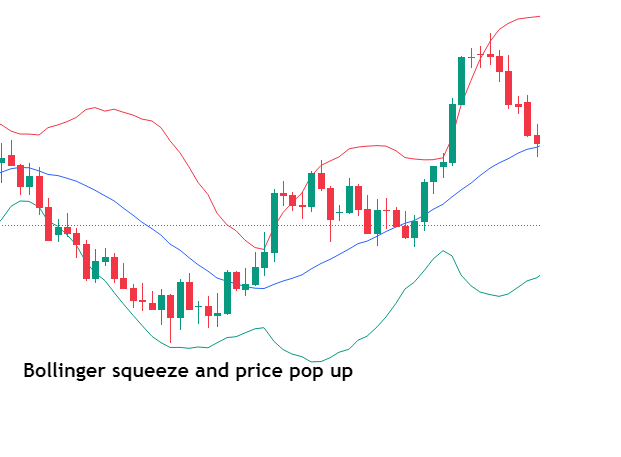
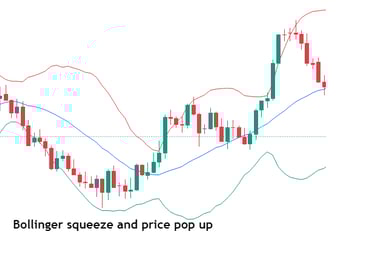
Narrow Bands: When the bands are close together (contracting), it indicates low volatility. This often precedes a significant price movement.
Wide Bands: When the bands are far apart (expanding), it indicates high volatility. This can signal the continuation of a strong trend.
3. Trend Following
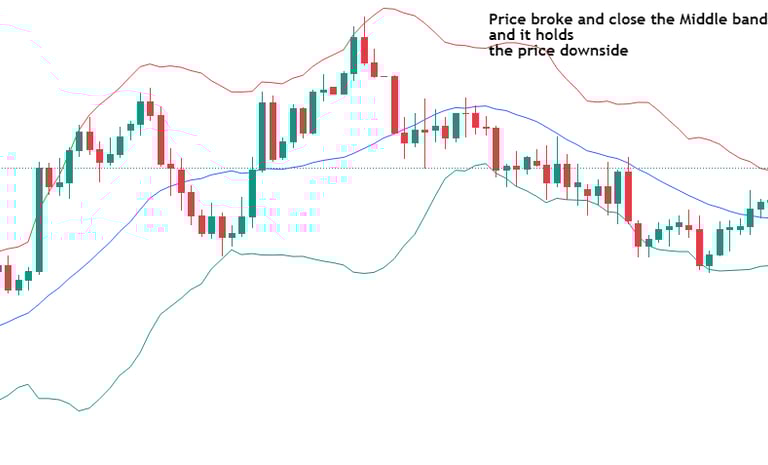
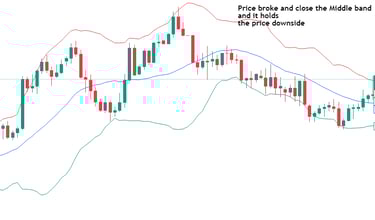
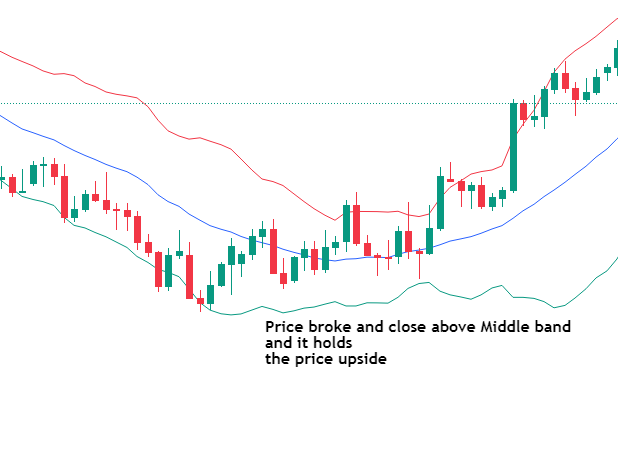
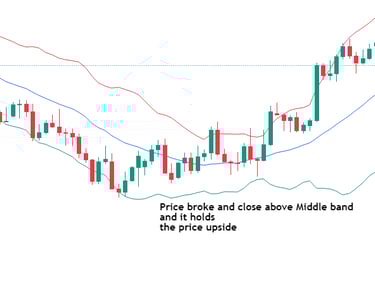
Upper Band Breakout: If the price breaks above the upper band and stays above it, it can indicate the start of a strong upward trend.
Lower Band Breakout: If the price breaks below the lower band and stays below it, it can indicate the start of a strong downward trend.
4. Mean Reversion
Price Returning to the Mean: Bollinger Bands assume that prices tend to revert to the mean (the middle band or SMA). If the price moves significantly away from the middle band, it might eventually move back towards it. Traders might use this for reversion strategies, buying when the price is at the lower band and selling when it is at the upper band.
Example of Bollinger Bands in Use
Buy Signal:
When the price falls to the lower band and starts to move up, it can be a buy signal, especially if the bands are narrowing, indicating reduced volatility and potential for a reversal.
Additional confirmation can be obtained by looking at other indicators like RSI or MACD.
Sell Signal:
When the price rises to the upper band and starts to move down, it can be a sell signal, especially if the bands are narrowing, indicating reduced volatility and potential for a reversal.
Additional confirmation can be obtained by looking at other indicators like RSI or MACD.
Continuation Patterns:
If the price hugs the upper band during an uptrend or the lower band during a downtrend, it suggests a strong trend and continuation in that direction.
Conclusion
Bollinger Bands are versatile and widely used in technical analysis for identifying overbought and oversold conditions, analyzing volatility, following trends, and implementing mean reversion strategies. By combining Bollinger Bands with other technical indicators, traders can enhance their ability to make informed trading decisions and improve their trading strategies.
Popular Chart Indicators
Moving Average Convergence Divergence (MACD)
Description: The Moving Average Convergence Divergence (MACD) is a trend-following momentum indicator that shows the relationship between two moving averages of a security’s price. Developed by Gerald Appel in the late 1970s, the MACD is used to identify changes in the strength, direction, momentum, and duration of a trend.
Components:
MACD Line: The difference between the 12-day Exponential Moving Average (EMA) and the 26-day EMA.
MACD Line=EMA12−EMA26MACD Line=EMA12−EMA26
Signal Line: A 9-day EMA of the MACD Line.
Signal Line=EMA9(MACD Line)Signal Line=EMA9(MACD Line)
Histogram: The difference between the MACD Line and the Signal Line.
Histogram=MACD Line−Signal LineHistogram=MACD Line−Signal Line
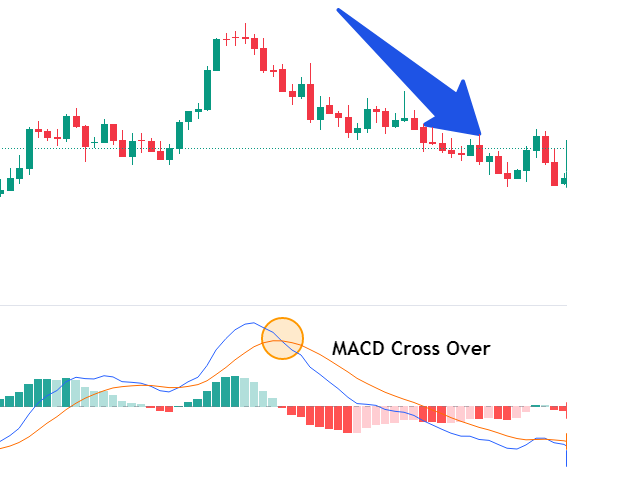
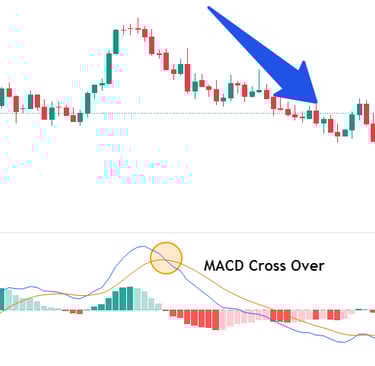
MACD
Usage
The MACD is used to spot changes in the strength, direction, momentum, and duration of a trend in a stock's price. Here are common strategies and uses:
1. MACD Line and Signal Line Crossovers
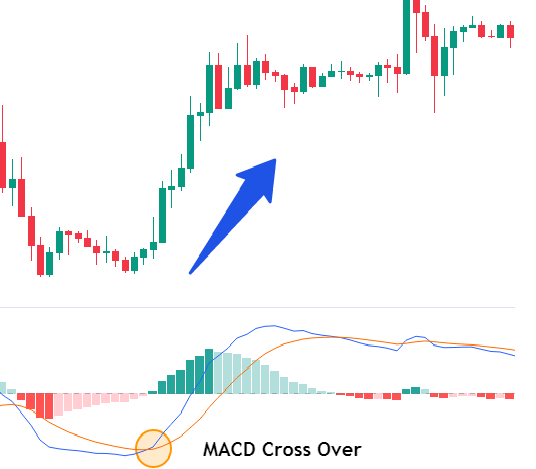
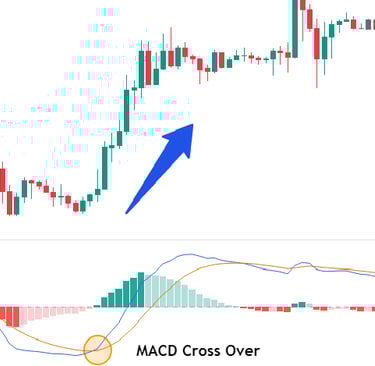
Bullish Crossover: When the MACD Line crosses above the Signal Line, it generates a bullish signal, indicating that it might be a good time to buy.
Bearish Crossover: When the MACD Line crosses below the Signal Line, it generates a bearish signal, indicating that it might be a good time to sell.
2. Histogram Analysis
Positive Histogram: When the MACD Line is above the Signal Line, the histogram is positive, suggesting upward momentum.
Negative Histogram: When the MACD Line is below the Signal Line, the histogram is negative, suggesting downward momentum.
Divergence: If the price is making new highs or lows but the MACD histogram is not, this can indicate a potential reversal. For example, if prices reach a new high but the MACD histogram forms a lower high, it may signal weakening momentum.
3. Zero Line Crossovers
Above Zero Line: When both the MACD Line and Signal Line are above the zero line, it indicates a bullish trend.
Below Zero Line: When both the MACD Line and Signal Line are below the zero line, it indicates a bearish trend.
4. Trend Confirmation
Trend Strength: The distance between the MACD Line and the Signal Line can indicate the strength of the trend. Wider separation suggests a stronger trend.
Trend Reversal: A change in the direction of the MACD Line can signal a potential trend reversal.
Example of MACD in Use
Bullish Signal:
If the MACD Line crosses above the Signal Line while both are below the zero line, it indicates a potential bullish reversal.
Confirmation can be sought by checking for higher highs in price and positive histogram values.
Bearish Signal:
If the MACD Line crosses below the Signal Line while both are above the zero line, it indicates a potential bearish reversal.
Confirmation can be sought by checking for lower lows in price and negative histogram values.
Conclusion
The MACD is a versatile and widely-used indicator that provides insights into price trends, momentum, and potential reversal points. By analyzing the crossovers, histogram, and zero line movements, traders can develop strategies to enter and exit trades effectively. Combining MACD with other indicators and analysis techniques can further enhance its reliability and the accuracy of trading decisions.
Relative Strength Index (RSI)
Description: The Relative Strength Index (RSI) is a momentum oscillator developed by J. Welles Wilder in 1978. It measures the speed and change of price movements on a scale from 0 to 100. RSI helps identify overbought or oversold conditions in a market, indicating potential reversal points.
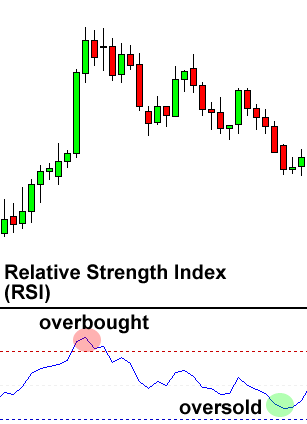
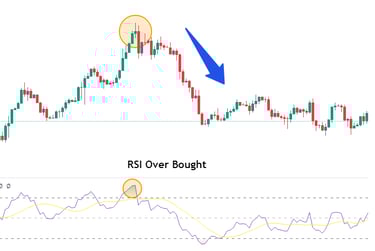
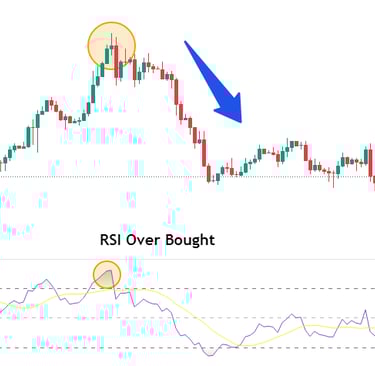
RSI (Relative Strength Index)
Usage
The RSI is used to identify overbought and oversold conditions, potential reversal points, and trends in the market. Here are some common strategies and uses:
1. Identifying Overbought and Oversold Conditions
Overbought Condition: When the RSI is above 70, it suggests that the asset might be overbought, indicating a potential sell signal.
Oversold Condition: When the RSI is below 30, it suggests that the asset might be oversold, indicating a potential buy signal.
2. Centerline Crossover
Bullish Crossover: When the RSI crosses above the centerline (50), it indicates increasing bullish momentum.
Bearish Crossover: When the RSI crosses below the centerline (50), it indicates increasing bearish momentum.
3. Failure Swings
Bullish Failure Swing: Occurs when the RSI falls below 30 (oversold), rises above 30, pulls back, and then moves above the previous high. This pattern indicates a potential buy signal.
Bearish Failure Swing: Occurs when the RSI rises above 70 (overbought), falls below 70, rebounds, and then falls below the previous low. This pattern indicates a potential sell signal.
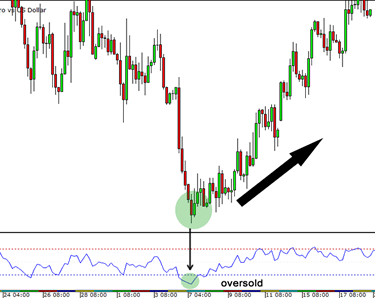
Example of RSI in Use
Buy Signal:
When the RSI falls below 30 and then rises back above it, it indicates that the asset is oversold and could be a buying opportunity.
Confirmation can be sought from other technical indicators or chart patterns to validate the signal.
Sell Signal:
When the RSI rises above 70 and then falls back below it, it indicates that the asset is overbought and could be a selling opportunity.
Confirmation can be sought from other technical indicators or chart patterns to validate the signal.
Conclusion
The RSI is a powerful and widely-used momentum oscillator that provides valuable insights into overbought and oversold conditions, trend strength, and potential reversal points. By understanding and utilizing the RSI effectively, traders can enhance their ability to make informed trading decisions and develop robust trading strategies. Combining RSI with other technical indicators and analysis methods can further improve its accuracy and reliability.


The Stochastic Oscillator is a momentum indicator developed by George Lane in the late 1950s. It compares a particular closing price of a security to a range of its prices over a certain period of time. The sensitivity of the oscillator to market movements can be reduced by adjusting the time period or by taking a moving average of the result.
The Stochastic Oscillator is based on the idea that closing prices tend to close near the high of the trading range during an uptrend, and near the low of the range during a downtrend.
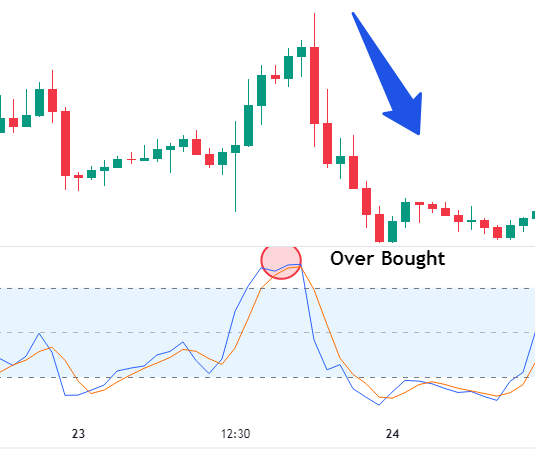
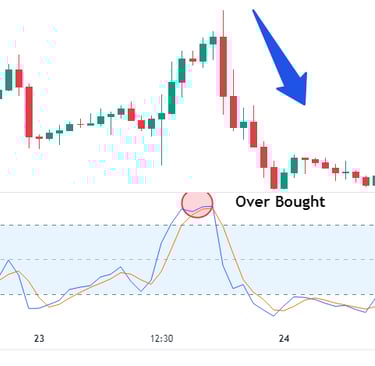
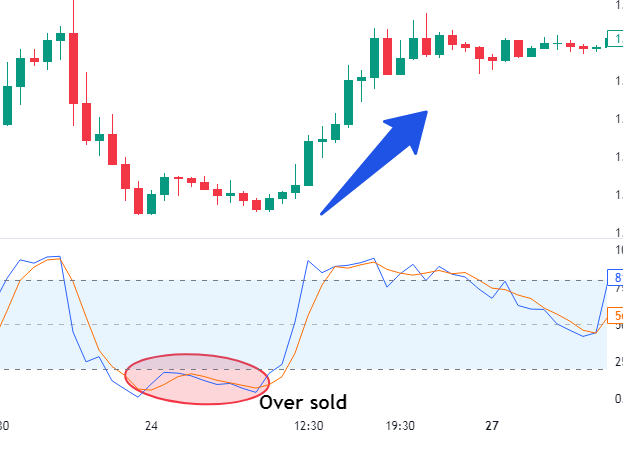
Stochastic Oscillator
Usage
The Stochastic Oscillator is used to identify overbought and oversold conditions, potential reversal points, and to spot divergences that can signal potential trend changes. Here are common strategies and uses:
1. Identifying Overbought and Oversold Conditions
Overbought Condition: When the Stochastic Oscillator is above 80, it indicates that the security may be overbought and due for a correction or pullback. This is a potential sell signal.
Oversold Condition: When the Stochastic Oscillator is below 20, it indicates that the security may be oversold and due for a bounce or rally. This is a potential buy signal.
2. Crossovers
Bullish Crossover: When the %K line crosses above the %D line, it can be a bullish signal, indicating that the price may move higher.
Bearish Crossover: When the %K line crosses below the %D line, it can be a bearish signal, indicating that the price may move lower.
Example of Stochastic Oscillator in Use
Buy Signal:
When the Stochastic Oscillator falls below 20 (oversold) and then rises above it, it indicates a potential buying opportunity.
Confirmation can be sought by looking for other bullish signals, such as trendlines or support levels.
Sell Signal:
When the Stochastic Oscillator rises above 80 (overbought) and then falls below it, it indicates a potential selling opportunity.
Confirmation can be sought by looking for other bearish signals, such as trendlines or resistance levels.
Conclusion
The Stochastic Oscillator is a versatile and widely-used momentum indicator that provides insights into overbought and oversold conditions, potential reversal points, and trend strength. By understanding and utilizing the Stochastic Oscillator effectively, traders can enhance their ability to make informed trading decisions and develop robust trading strategies. Combining the Stochastic Oscillator with other technical indicators and analysis methods can further improve its accuracy and reliability.
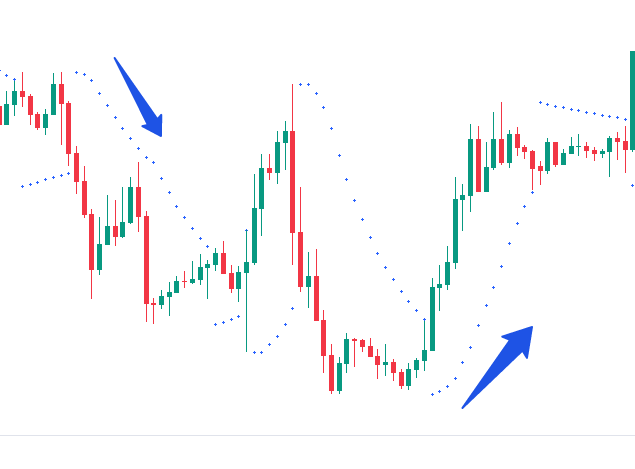
The Parabolic SAR (Stop and Reverse) is a trend-following indicator developed by J. Welles Wilder Jr. It is used to determine potential reversal points in the market. The Parabolic SAR is plotted on the price chart as a series of dots that appear above or below the price bars. When the dots are below the price, it indicates an uptrend; when the dots are above the price, it indicates a downtrend.
Parabolic SAR
Usage
The Parabolic SAR is primarily used to identify potential reversal points and to set trailing stop-loss orders. Here are common strategies and uses:
1. Identifying Trend Direction
Uptrend: When the dots are below the price, it indicates an uptrend. Traders may look for buying opportunities.
Downtrend: When the dots are above the price, it indicates a downtrend. Traders may look for selling opportunities.
2. Setting Stop-Loss Orders
Trailing Stops: The Parabolic SAR can be used to set trailing stop-loss orders. In an uptrend, the stop-loss level is moved up along with the SAR value. In a downtrend, the stop-loss level is moved down along with the SAR value. This helps lock in profits while allowing the trade to run as long as the trend continues.
3. Entry and Exit Points
Entry Point: Traders may enter a position when the Parabolic SAR signals a trend reversal. For example, entering a long position when the dots move below the price, indicating the start of an uptrend.
Exit Point: Traders may exit a position when the Parabolic SAR signals a trend reversal. For example, exiting a long position when the dots move above the price, indicating the start of a downtrend.
Example of Parabolic SAR in Use
Buy Signal:
When the dots switch from being above the price to below the price, it indicates a potential uptrend. This can be a signal to buy or go long.
Additional confirmation can be sought from other technical indicators or chart patterns to validate the signal.
Sell Signal:
When the dots switch from being below the price to above the price, it indicates a potential downtrend. This can be a signal to sell or go short.
Additional confirmation can be sought from other technical indicators or chart patterns to validate the signal.
Trailing Stop-Loss:
In an uptrend, the SAR value can be used as a trailing stop-loss level. As the price moves higher, the stop-loss level is adjusted upward according to the SAR values.
In a downtrend, the SAR value can be used as a trailing stop-loss level. As the price moves lower, the stop-loss level is adjusted downward according to the SAR values.
Conclusion
The Parabolic SAR is a valuable tool for identifying trend direction, setting trailing stop-loss orders, and pinpointing potential entry and exit points in the market. By understanding and utilizing the Parabolic SAR effectively, traders can enhance their ability to manage risk and capitalize on market trends. Combining the Parabolic SAR with other technical indicators and analysis methods can further improve its accuracy and reliability.
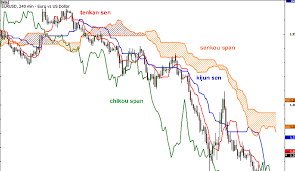
Ichimoku Kinko Hyo, often referred to as the Ichimoku Cloud or simply Ichimoku, is a comprehensive technical analysis system developed by Goichi Hosoda in the late 1930s. It provides insight into trend direction, momentum, and potential support and resistance levels. The name "Ichimoku Kinko Hyo" translates to "one look equilibrium chart," reflecting its goal to offer a holistic view of the market at a glance.
Ichimoku Kinko Hyo
Components:
The Ichimoku system consists of five main components:
Tenkan-sen (Conversion Line):
Tenkan-sen=(Highest High over the last 9 periods+Lowest Low over the last 9 periods)2Tenkan-sen=2(Highest High over the last 9 periods+Lowest Low over the last 9 periods)
This line is a short-term indicator and shows the average of the highest high and lowest low over the last 9 periods.
Kijun-sen (Base Line):
Kijun-sen=(Highest High over the last 26 periods+Lowest Low over the last 26 periods)2Kijun-sen=2(Highest High over the last 26 periods+Lowest Low over the last 26 periods)
This line is a medium-term indicator and shows the average of the highest high and lowest low over the last 26 periods.
Senkou Span A (Leading Span A):
Senkou Span A=(Tenkan-sen+Kijun-sen)2Senkou Span A=2(Tenkan-sen+Kijun-sen)
This line is plotted 26 periods ahead and forms one edge of the Kumo (cloud).
Senkou Span B (Leading Span B):
Senkou Span B=(Highest High over the last 52 periods+Lowest Low over the last 52 periods)2Senkou Span B=2(Highest High over the last 52 periods+Lowest Low over the last 52 periods)
This line is plotted 26 periods ahead and forms the other edge of the Kumo (cloud).
Chikou Span (Lagging Span):
Chikou Span=Current Closing Price plotted 26 periods backChikou Span=Current Closing Price plotted 26 periods back
Usage
The Ichimoku system is used to identify trend direction, momentum, and potential support and resistance levels. Here are some common strategies and uses:
1. Identifying Trend Direction
Bullish Trend: When the price is above the Kumo (cloud), it indicates a bullish trend. A stronger bullish signal is when the Senkou Span A is above the Senkou Span B.
Bearish Trend: When the price is below the Kumo (cloud), it indicates a bearish trend. A stronger bearish signal is when the Senkou Span A is below the Senkou Span B.
Neutral Trend: When the price is within the Kumo (cloud), it indicates a sideways or uncertain trend.
2. Tenkan-sen and Kijun-sen Crossovers
Bullish Crossover: When the Tenkan-sen crosses above the Kijun-sen, it generates a bullish signal, indicating potential upward movement.
Bearish Crossover: When the Tenkan-sen crosses below the Kijun-sen, it generates a bearish signal, indicating potential downward movement.
3. Chikou Span Confirmation
Bullish Confirmation: When the Chikou Span is above the price from 26 periods ago, it confirms the bullish trend.
Bearish Confirmation: When the Chikou Span is below the price from 26 periods ago, it confirms the bearish trend.
4. Support and Resistance Levels
The edges of the Kumo (cloud) act as dynamic support and resistance levels. The wider the Kumo, the stronger the support or resistance.
Example of Ichimoku in Use
Buy Signal:
When the price is above the Kumo, the Tenkan-sen crosses above the Kijun-sen, and the Chikou Span is above the price from 26 periods ago, it indicates a strong buy signal.
Confirmation can be sought by observing if the Senkou Span A is above the Senkou Span B.
Sell Signal:
When the price is below the Kumo, the Tenkan-sen crosses below the Kijun-sen, and the Chikou Span is below the price from 26 periods ago, it indicates a strong sell signal.
Confirmation can be sought by observing if the Senkou Span A is below the Senkou Span B.
Conclusion
The Ichimoku Kinko Hyo system is a comprehensive tool that provides traders with a detailed view of market trends, momentum, and potential support and resistance levels. By combining its various components, traders can make more informed decisions about market entry and exit points. Integrating Ichimoku with other technical indicators can further enhance its effectiveness and reliability in various market conditions.

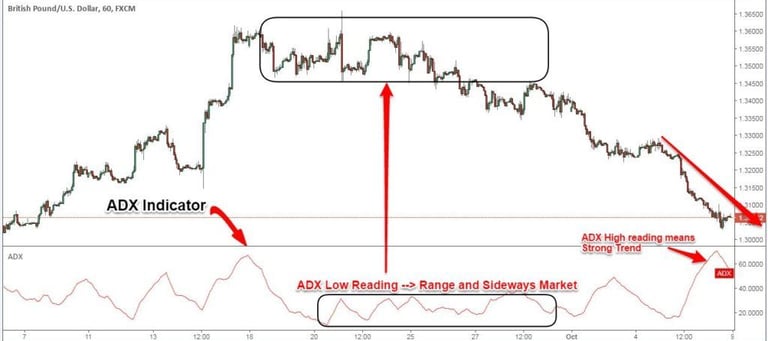
The Average Directional Index (ADX) is a technical analysis indicator developed by J. Welles Wilder Jr. to quantify the strength of a trend. It does not indicate the direction of the trend, only the strength, and is used to determine whether a market is trending or not. The ADX ranges from 0 to 100, with higher values indicating a stronger trend.
Components: The ADX is derived from two other indicators: the Positive Directional Indicator (+DI) and the Negative Directional Indicator (-DI). These are used to measure trend direction, while the ADX itself measures trend strength.
Average Directional Index (ADX)
Usage:
The ADX is primarily used to determine the strength of a trend. Here are common uses:
1. Assessing Trend Strength
Strong Trend: An ADX value above 25 typically indicates a strong trend.
Weak Trend: An ADX value below 20 typically indicates a weak or non-existent trend.
2. Combining with +DI and -DI
Bullish Signal: When the +DI is above the -DI and the ADX is above 25, it suggests a strong bullish trend.
Bearish Signal: When the -DI is above the +DI and the ADX is above 25, it suggests a strong bearish trend.
Example of ADX in Use:
Identifying Trend Strength:
If the ADX is rising and above 25, it indicates that the trend (whether up or down) is strengthening.
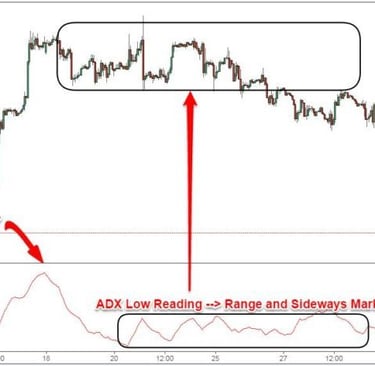
If the ADX is falling and below 20, it indicates that the trend is weakening or the market is moving sideways.
Combining with Other Indicators:
Traders often use the ADX in conjunction with other indicators to confirm trends. For example, combining the ADX with moving averages or the Relative Strength Index (RSI) can provide more comprehensive insights.
Conclusion:
The Average Directional Index (ADX) is a valuable tool for traders to assess the strength of a trend. By understanding and using the ADX, traders can better identify strong trends, avoid weak trends, and make more informed trading decisions. Integrating the ADX with other technical analysis tools can further enhance its effectiveness and accuracy.
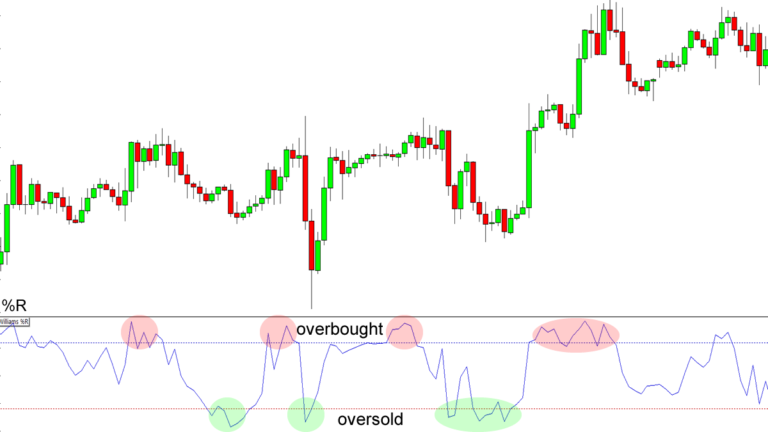
Williams %R, also known as Williams Percent Range, is a momentum indicator developed by Larry Williams. It measures the level of the closing price relative to the high-low range over a specified period, typically 14 days. The indicator helps traders identify overbought and oversold conditions in a market.
Calculation: The Williams %R is calculated using the following formula:
Williams %R=(Highest High−Close)(Highest High−Lowest Low)×−100Williams %R=(Highest High−Lowest Low)(Highest High−Close)×−100
Where:
Highest High: The highest price over the look-back period.
Lowest Low: The lowest price over the look-back period.
Close: The most recent closing price.
Williams %R ranges from 0 to -100. A reading above -20 indicates that the security is overbought, while a reading below -80 indicates that the security is oversold.
Williams % Range
Usage:
The Williams %R is used to identify overbought and oversold conditions, potential reversal points, and divergences in the market. Here are common strategies and uses:
1. Identifying Overbought and Oversold Conditions
Overbought Condition: When the Williams %R is above -20, it suggests that the security may be overbought and could be due for a correction or pullback. This is a potential sell signal.
Oversold Condition: When the Williams %R is below -80, it suggests that the security may be oversold and could be due for a bounce or rally. This is a potential buy signal.
2. Spotting Reversal Points
Reversal from Overbought: If the Williams %R moves from above -20 to below -20, it may indicate a potential reversal to the downside.
Reversal from Oversold: If the Williams %R moves from below -80 to above -80, it may indicate a potential reversal to the upside.
Example of Williams %R in Use
Buy Signal:
When the Williams %R moves below -80 (oversold) and then rises above it, it indicates a potential buying opportunity.
Confirmation can be sought by looking for other bullish signals, such as trendlines, support levels, or other indicators.
Sell Signal:
When the Williams %R moves above -20 (overbought) and then falls below it, it indicates a potential selling opportunity.
Confirmation can be sought by looking for other bearish signals, such as trendlines, resistance levels, or other indicators.
Conclusion:
The Williams %R is a valuable tool for traders to identify overbought and oversold conditions, potential reversal points, and divergences in the market. By understanding and utilizing the Williams %R effectively, traders can enhance their ability to make informed trading decisions and develop robust trading strategies. Combining Williams %R with other technical indicators and analysis methods can further improve its accuracy and reliability.