Sentiment analysis
Sentiment analysis in forex trading refers to the process of assessing the overall attitude or mood of investors towards a particular currency or the forex market in general. This type of analysis aims to gauge whether the market participants are bullish (expecting prices to rise) or bearish (expecting prices to fall). Sentiment analysis is based on the idea that the collective actions and attitudes of traders can influence currency price movements.
Sentiment Analysis
Key Aspects of Market Sentiment
Bullish Sentiment: Indicates that investors are optimistic about the market or asset, expecting prices to rise. Common signs of bullish sentiment include strong buying activity, rising prices, and positive news.
Bearish Sentiment: Indicates that investors are pessimistic about the market or asset, expecting prices to fall. Common signs of bearish sentiment include strong selling activity, falling prices, and negative news.
Neutral Sentiment: Occurs when the market does not show a clear direction, often leading to a sideways or ranging market.
Factors Influencing Market Sentiment
Economic Data: Key economic indicators such as GDP, employment reports, inflation rates, and consumer confidence can significantly impact market sentiment.
News Events: Political events, corporate earnings reports, and global developments can quickly shift market sentiment.
Geopolitical Factors: Tensions, conflicts, and diplomatic developments can affect investor confidence and market sentiment.
Market Trends: Long-term trends in the market can shape sentiment. For example, a prolonged bull market can create a generally optimistic sentiment among investors.
Investor Psychology: Human emotions and cognitive biases play a crucial role in market sentiment. Fear, greed, and overreaction to news can drive market movements.

The Commitments of Traders (COT) Report
The Commitments of Traders (COT) report is a weekly publication by the U.S. Commodity Futures Trading Commission (CFTC) that provides insights into the positioning of various market participants in the futures markets. The COT report shows the aggregate positions held by three main types of traders: commercial traders (hedgers), non-commercial traders (speculators), and non-reportable traders (small speculators).
The Commitments of Traders (COT) Report
How to Access the COT Report
CFTC Website: The CFTC publishes the COT report on its website every Friday at 3:30 p.m. Eastern Time (ET). You can access it directly from the CFTC website in various formats, including HTML, CSV, and Excel.
Third-Party Websites: Many financial news websites, trading platforms, and market data providers offer the COT report data in a user-friendly format. Examples include TradingView, Investing.com, and MyTradingHub.
How to Use the COT Report in Forex Trading
Sentiment Analysis:
The COT report provides valuable insights into the sentiment of major market participants. Analyzing changes in the positioning of commercial and non-commercial traders can help gauge overall market sentiment.
For example, if commercial traders (often considered "smart money") are heavily net long or short in a particular currency pair, it may indicate a potential reversal or continuation of the trend.
Contrarian Trading:
Many traders use the COT report for contrarian trading strategies. When the positioning of non-commercial traders (often considered "dumb money") reaches extreme levels, it may signal a market reversal.
For instance, if non-commercial traders are heavily net long in a currency pair and the price has been rising, it could indicate that a reversal to the downside is imminent.
Confirmation of Technical Analysis:
Some traders use the COT report to confirm their technical analysis signals. For example, if a currency pair is showing signs of a bullish reversal on the chart, and the COT report shows that commercial traders are also increasing their long positions, it may provide additional confidence in the trade setup.
Risk Management:
The COT report can also help in risk management by providing insights into potential market sentiment shifts. If the positioning of market participants changes drastically, it may prompt traders to adjust their risk management parameters, such as stop-loss levels.
Long-Term Trend Analysis:
Traders often use the COT report for long-term trend analysis. By tracking changes in positioning over time, traders can identify long-term trends and potential turning points in the market.
Example of Using the COT Report in Forex Trading
Let's say you're trading the EUR/USD currency pair and you've identified a potential bullish reversal based on technical analysis. You decide to check the latest COT report for additional confirmation:
Check the COT Report:
You access the latest COT report and notice that non-commercial traders (speculators) have significantly increased their net long positions in EUR/USD over the past week, reaching extreme levels.
Analysis:
This extreme positioning of non-commercial traders aligns with your bullish reversal thesis, as it suggests that the market may be overextended to the downside.
Trade Execution:
With the additional confirmation from the COT report, you decide to enter a long position in EUR/USD, setting a stop-loss below the recent swing low and a take-profit target based on your risk-reward ratio.
Monitor the Trade:
You monitor the trade closely, keeping an eye on any further developments in the COT report and adjusting your risk management parameters as needed.
By incorporating the COT report into your forex trading analysis, you can gain valuable insights into market sentiment and potentially improve your trading decisions. However, it's important to remember that the COT report is just one tool among many and should be used in conjunction with other forms of analysis for more comprehensive trading decisions.

The US Dollar Index (USDX)
The US Dollar Index (USDX) is a measure of the value of the United States dollar relative to a basket of foreign currencies. It provides traders and investors with a benchmark to assess the overall strength or weakness of the US dollar against a group of major currencies. The index is widely used as a tool for analyzing and trading forex and commodities markets.
The US Dollar Index (USDX)
Composition of the US Dollar Index:
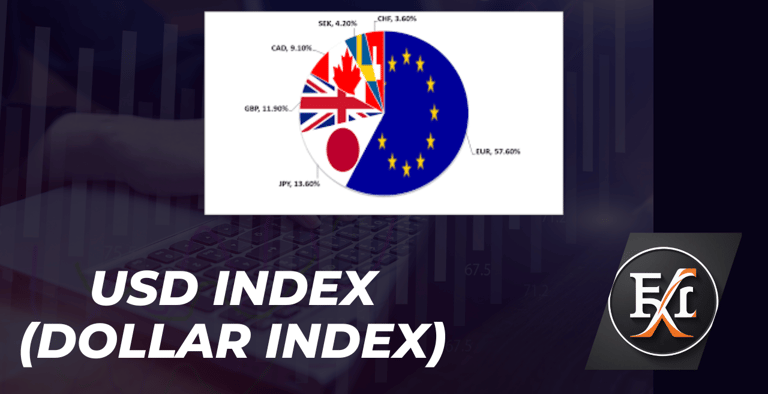
The USDX is composed of a weighted average of six major currencies, with each currency assigned a specific weight:
Euro (EUR): 57.6% weight
Japanese Yen (JPY): 13.6% weight
British Pound (GBP): 11.9% weight
Canadian Dollar (CAD): 9.1% weight
Swedish Krona (SEK): 4.2% weight
Swiss Franc (CHF): 3.6% weight
How the US Dollar Index is Calculated:
The USDX is calculated using a geometrically weighted formula that compares the US dollar against the basket of currencies mentioned above. The formula involves taking the weighted geometric mean of the exchange rates between the US dollar and each currency in the basket.
Uses of the US Dollar Index in Trading:
Gauging US Dollar Strength or Weakness:
Traders use the USDX to assess the overall strength or weakness of the US dollar compared to a basket of major currencies. A rising USDX indicates strength in the US dollar, while a falling USDX indicates weakness.
Forecasting Forex Movements:
Forex traders use the USDX as a leading indicator to forecast potential movements in individual currency pairs. For example, if the USDX is rising, traders might expect the USD to strengthen against other currencies and adjust their forex trading accordingly.
Trading Commodities:
The USDX is also used by commodity traders to assess the impact of currency movements on commodity prices. Commodities such as gold, oil, and metals are priced in US dollars, so changes in the value of the US dollar can influence commodity prices inversely. A stronger US dollar typically leads to lower commodity prices, while a weaker US dollar tends to boost commodity prices.
Diversification:
Investors use the USDX as part of their portfolio diversification strategy to hedge against currency risk. By including assets denominated in US dollars or correlated with the USDX, investors can mitigate the impact of currency fluctuations on their investment returns.
Interpreting US Dollar Index Movements:
Rising USDX:
Indicates strength in the US dollar relative to the basket of currencies.
May lead to lower prices for commodities priced in US dollars and weaker performance for non-US dollar currencies in forex trading.
Falling USDX:
Indicates weakness in the US dollar relative to the basket of currencies.
May lead to higher prices for commodities priced in US dollars and stronger performance for non-US dollar currencies in forex trading.
Conclusion:
The US Dollar Index (USDX) serves as a valuable tool for traders and investors to assess the strength or weakness of the US dollar against a basket of major currencies. By analyzing USDX movements, traders can make informed decisions in forex trading and commodities markets, adjust their trading strategies, and manage currency-related risks effectively.
Intermarket correlations
Intermarket correlations
Intermarket correlations in forex refer to the relationships between different financial markets, including currency markets, commodities markets (such as gold and oil), bond markets, and other asset classes. Understanding these correlations can provide valuable insights for traders and investors, helping them identify potential trading opportunities and manage risk more effectively.
Intermarket Correlations in Forex:
Currencies and Commodities:
Gold: Gold is often viewed as a safe-haven asset and tends to have an inverse correlation with the US dollar. When the US dollar strengthens, the price of gold typically falls, and vice versa. This relationship is due to the fact that gold is priced in US dollars, making it cheaper for investors holding other currencies when the dollar weakens.
Oil: The relationship between oil prices and currency markets can be more complex. Generally, oil prices and the value of currencies of oil-producing countries (such as the Canadian dollar or Norwegian krone) have a positive correlation because higher oil prices increase the revenues of these countries, leading to a stronger currency. However, for oil-importing countries, higher oil prices can lead to inflationary pressures and economic slowdowns, potentially weakening their currencies.
Currencies and Bond Yields:
Government bond yields, particularly those of major economies such as the United States, can have a significant impact on currency values. Higher bond yields typically attract foreign investment, leading to an appreciation of the currency. Conversely, lower bond yields may lead to capital outflows and a depreciation of the currency. Traders often monitor yield differentials between countries to gauge potential currency movements.
Currencies and Economic Indicators:
Economic indicators such as GDP growth, employment data, inflation rates, and trade balances can influence currency values. Strong economic data typically leads to appreciation of the currency, while weak data may result in depreciation. Bond yields often react to changes in economic indicators, leading to correlations between bond yields and currency values.
Intermarket Correlations in Practice:
Trading Strategies:
Traders can use intermarket correlations to develop trading strategies. For example, if bond yields in a particular country are expected to rise due to improving economic conditions, traders may consider buying the currency of that country in anticipation of currency appreciation.
Similarly, if oil prices are expected to rise due to supply disruptions, traders may consider buying currencies of oil-exporting countries.
Risk Management:
Understanding intermarket correlations can help traders manage risk more effectively. For example, if a trader is long on a currency pair with a positive correlation to oil prices, they may consider hedging their position if they expect oil prices to fall or bond yields to rise.
Market Analysis:
Intermarket correlations can provide valuable insights into broader market trends and sentiment. By analyzing correlations between currencies, commodities, bond yields, and other asset classes, traders can develop a more comprehensive view of the market and make more informed trading decisions.
Risks and Considerations:
Changing Correlations:
Intermarket correlations are not static and can change over time due to shifts in market dynamics, economic conditions, and geopolitical events. Traders should regularly reassess correlations to ensure their trading strategies remain relevant.
False Correlations:
While intermarket correlations can provide useful insights, traders should be cautious of false correlations or spurious relationships that may not hold over the long term. It's essential to conduct thorough analysis and avoid making trading decisions solely based on correlations.
Diversification:
Intermarket correlations can also highlight opportunities for diversification. By trading assets with low or negative correlations, traders can potentially reduce portfolio volatility and enhance risk-adjusted returns.
In summary, intermarket correlations play a crucial role in forex trading by highlighting relationships between currencies, commodities, bond yields, and other asset classes. By understanding these correlations and incorporating them into their trading strategies, traders can gain a deeper insight into market dynamics, identify potential trading opportunities, and manage risk more effectively.
Carry Trade
Carry Trade
A carry trade is a popular trading strategy in the foreign exchange (forex) market and other financial markets where traders aim to profit from the interest rate differentials between two currencies. In a carry trade, traders borrow funds in a low-yielding currency and invest them in a higher-yielding currency, earning the interest rate differential (or "carry") between the two currencies.
How Carry Trade Works:
Selecting Currency Pairs:
Carry trades typically involve currency pairs where one currency has a significantly higher interest rate than the other. Traders typically choose to borrow in a low-interest-rate currency (the funding currency) and invest in a higher-yielding currency (the target currency).
Borrowing and Investing:
Traders borrow funds in the low-yielding currency by selling it short in the forex market. They then use the proceeds to buy the higher-yielding currency, which they hold as an investment.
Earning Interest:
Traders earn interest on the invested currency, typically paid daily or at regular intervals by their forex broker. The interest earned on the target currency should exceed the interest paid on the borrowed currency, generating a positive carry.
Profit Generation:
The profit in a carry trade comes from the interest rate differential between the two currencies. As long as the interest earned on the target currency exceeds the interest paid on the funding currency, traders can profit from the carry trade.
Exchange Rate Risk:
While carry trades aim to profit from interest rate differentials, traders are also exposed to exchange rate fluctuations between the two currencies. A significant depreciation of the target currency relative to the funding currency can offset or even reverse the gains from interest differentials.
Example of a Carry Trade:
Let's consider an example of a carry trade involving the USD/JPY currency pair:
Interest Rate Differential:
Suppose the interest rate in the United States (USD) is 2%, while the interest rate in Japan (JPY) is 0.1%. This creates a significant interest rate differential of 1.9%.
Execution:
A trader borrows funds in Japanese yen (JPY) by selling JPY and simultaneously buys US dollars (USD) with the proceeds.
The trader then invests the USD in US government bonds or other high-yielding assets, earning interest on the investment.
Earning Carry:
The trader earns interest on the invested USD, which exceeds the interest paid on the borrowed JPY, resulting in a positive carry.
For example, if the trader borrows 100 million JPY and earns 2% interest on the USD investment, they may earn $2 million USD annually (assuming no exchange rate fluctuations).
Profitability:
The profitability of the carry trade depends on the stability of exchange rates between the two currencies and the interest rate differentials. Traders monitor market conditions closely to manage exchange rate risk and ensure profitability.
Considerations and Risks:
Exchange Rate Volatility: Exchange rate fluctuations can impact the profitability of carry trades, especially if the target currency depreciates significantly against the funding currency.
Interest Rate Changes: Changes in central bank policies and interest rates can affect carry trade profitability. Traders need to stay informed about monetary policy decisions and economic conditions in the countries involved.
Leverage: Carry trades often involve leverage to amplify potential returns. However, leverage also increases risk and can magnify losses if the trade goes against expectations.
Market Sentiment: Market sentiment and risk appetite can influence currency movements and impact carry trade profitability. Traders should consider broader market trends and sentiment when executing carry trades.
Liquidity Risk: In times of market stress or uncertainty, liquidity in certain currency pairs may decline, making it challenging to execute carry trades or close positions at desired levels.
Carry trades can be profitable in certain market conditions, especially when interest rate differentials are favorable and exchange rates are stable. However, traders should carefully assess risks and consider implementing risk management strategies to protect against potential losses.
News Trading
News trading in forex refers to the practice of trading financial instruments based on the release of economic news and data. Economic indicators, such as employment reports, GDP figures, interest rate decisions, inflation data, and other macroeconomic announcements, can significantly impact currency prices and create short-term trading opportunities for forex traders. News traders aim to capitalize on the market volatility and price movements triggered by these news events.
News Trading
How News Trading Works
Event Selection:
Traders identify upcoming economic events and news releases that have the potential to move the market significantly. These events are typically listed on economic calendars provided by financial websites and trading platforms.
Analysis and Forecasting:
Traders analyze the expected impact of the news event on the currency pair they intend to trade. They consider factors such as the consensus forecast, historical data, market expectations, and potential scenarios.
Trade Planning:
Based on their analysis, traders develop a trading plan, including entry and exit points, stop-loss and take-profit levels, and position size. They may choose to enter the market before the news release (pre-news trading) or wait for the data to be released (post-news trading).
Execution:
Traders execute their trades according to their predetermined plan. They may use market orders to enter the market quickly after the news release or pending orders to enter at specific price levels.
Risk Management:
Managing risk is crucial in news trading due to the heightened volatility during news events. Traders use stop-loss orders to limit potential losses and adjust their position size accordingly.
Monitoring and Adjustment:
Traders monitor the market closely after the news release to assess the impact on their trades. They may adjust their stop-loss and take-profit levels or close their positions early if necessary.
Strategies for News Trading
Breakout Trading:
Traders enter the market when price breaks out of a predefined range or technical pattern (e.g., triangle or rectangle pattern) following a news release.
Fade the News:
Traders take positions opposite to the initial market reaction, betting on a reversal once the initial volatility subsides. This strategy requires quick execution and contrarian thinking.
Straddle Strategy:
Traders place buy and sell orders on both sides of the current price before a significant news release. They aim to capture a large price movement in either direction.
Retracement Trading:
Traders wait for a pullback or retracement after a news-driven price spike to enter the market in the direction of the prevailing trend.
Risks and Considerations
Volatility: News trading can lead to significant price swings and increased market volatility, which can result in rapid gains or losses.
Slippage: During high-impact news releases, liquidity may be low, leading to slippage and wider spreads, especially if trading with market orders.
False Signals: Not all news releases result in significant market movements, and some may produce false signals, leading to losses for traders.
Fundamental Analysis: News trading requires a solid understanding of fundamental analysis and the ability to interpret economic data accurately.
Example of News Trading in Forex
Let's say the U.S. Non-Farm Payrolls (NFP) report is scheduled for release, and traders anticipate a positive outcome:
Analysis:
Traders analyze the consensus forecast and market expectations for the NFP report. They anticipate a strong jobs number, which could lead to a bullish reaction in the U.S. dollar.
Trade Planning:
Traders decide to enter a long position in USD/JPY ahead of the NFP release, expecting the U.S. dollar to strengthen against the Japanese yen.
Execution:
Traders place a buy order on USD/JPY just before the NFP release, using a market order to ensure quick execution.
Risk Management:
Traders set a stop-loss order below a recent support level to limit potential losses in case of an adverse market reaction.
Monitoring and Adjustment:
After the NFP release, traders monitor the market closely and adjust their stop-loss and take-profit levels based on price action and market sentiment.
By successfully trading news events, forex traders can capitalize on short-term market opportunities and potentially generate profits in a dynamic and fast-paced trading environment. However, it's essential to manage risk carefully and stay informed about upcoming news releases and their potential impact on the market.

Multiple Time frame Analysis
Multiple Time frame Analysis
Multiple Time Frame Analysis (MTFA) is a trading strategy that involves analyzing an asset's price action across different time frames to gain a comprehensive understanding of its trend, support and resistance levels, and potential entry and exit points. By observing the same asset on various time frames, traders can identify the primary trend, intermediate trends, and short-term price movements, allowing for more informed trading decisions.
How to Use Multiple Time Frame Analysis in Trading
Step-by-Step Guide
Select Time Frames:
Choose three time frames that represent long-term, intermediate-term, and short-term perspectives. Common combinations include:
Long-term: Daily (D1) or Weekly (W1)
Intermediate-term: 4-hour (H4) or 1-hour (H1)
Short-term: 15-minute (M15) or 5-minute (M5)
Analyze the Long-Term Trend:
Start with the longest time frame to determine the overall trend direction (uptrend, downtrend, or ranging). This helps establish the dominant market sentiment.
Identify major support and resistance levels and key moving averages.
Assess the Intermediate-Term Trend:
Move to the intermediate time frame to refine your analysis. Look for confirmation of the long-term trend or signs of potential reversals.
Identify intermediate support and resistance levels, chart patterns, and technical indicators (e.g., moving averages, RSI, MACD).
Examine the Short-Term Trend:
Use the shortest time frame to pinpoint precise entry and exit points. Analyze short-term price movements, candlestick patterns, and momentum indicators.
Look for alignment with the trends identified in the longer time frames. Ideally, the short-term trend should align with the direction of the long-term trend for higher probability trades.
Make Trading Decisions:
Entry Points: Enter trades when the short-term and intermediate-term trends align with the long-term trend. For example, in an overall uptrend (long-term), wait for short-term pullbacks and enter when the price resumes its upward movement.
Exit Points: Use the intermediate and short-term time frames to identify potential reversal points or profit-taking levels. Set stop-loss orders below support levels in an uptrend or above resistance levels in a downtrend.
Monitor and Adjust:
Continuously monitor the price action across all selected time frames. Be prepared to adjust your strategy if there are significant changes in the intermediate or long-term trends.
Example of Multiple Time Frame Analysis in Forex Trading
Let’s consider trading the EUR/USD pair:
Long-Term Analysis (Daily Chart):
Determine the primary trend: The daily chart shows an uptrend with higher highs and higher lows.
Identify major support and resistance levels: Key support at 1.1000 and resistance at 1.1500.
Intermediate-Term Analysis (4-Hour Chart):
Confirm the uptrend: The 4-hour chart also shows an uptrend, with the price respecting a rising trendline.
Look for potential entry points: A recent pullback to the trendline around 1.1200 provides a buying opportunity.
Short-Term Analysis (15-Minute Chart):
Pinpoint entry: The 15-minute chart shows a reversal pattern (e.g., bullish engulfing) at the trendline support around 1.1200.
Confirm momentum: RSI is rising from oversold levels, and MACD shows a bullish crossover.
Trade Execution:
Enter a long position at 1.1210 (just above the bullish engulfing pattern).
Set a stop-loss order below the recent low at 1.1180.
Set a take-profit order near the next resistance level at 1.1300.
Benefits of Multiple Time Frame Analysis
Comprehensive View: Provides a holistic view of the market, reducing the risk of false signals.
Better Timing: Enhances timing for entries and exits by aligning short-term trades with the overall trend.
Risk Management: Helps in setting more accurate stop-loss and take-profit levels.
Trend Confirmation: Confirms the primary trend, increasing the probability of successful trades.
Conclusion
Multiple Time Frame Analysis is a powerful tool in trading, allowing for a nuanced understanding of market dynamics across different time horizons. By aligning trades with the overall trend and using shorter time frames for precise entries and exits, traders can improve their decision-making process and increase the likelihood of successful trades.
Best Time Frame to Trade
Best Time Frame to Trade Intraday
The best time frame to trade intraday depends on your trading style, strategy, and preferences. Intraday trading, also known as day trading, involves buying and selling financial instruments within the same trading day. Here are some commonly used time frames and their respective characteristics to help you decide which might be best for you:
Common Intraday Trading Time Frames
1-Minute Chart (M1)
Characteristics: Very fast, suitable for scalpers who aim for small profits from quick trades.
Advantages: Provides the most detailed view of price action, allows for quick decision-making.
Disadvantages: High noise and market volatility can lead to false signals; requires constant attention and quick reflexes.
5-Minute Chart (M5)
Characteristics: Popular among scalpers and short-term day traders.
Advantages: Balances detail and noise, suitable for capturing small price movements.
Disadvantages: Still relatively fast and can produce a significant amount of noise.
15-Minute Chart (M15)
Characteristics: Commonly used by day traders for short-term trades.
Advantages: Offers a clearer picture of intraday trends and reduces some of the noise seen in lower time frames.
Disadvantages: Trades may last longer than those based on lower time frames, requiring patience.
30-Minute Chart (M30)
Characteristics: Suitable for capturing more substantial intraday trends.
Advantages: Less noise, allows for more defined trends and patterns.
Disadvantages: Requires patience and may result in fewer trading opportunities compared to lower time frames.
1-Hour Chart (H1)
Characteristics: Often used by swing traders as well as day traders.
Advantages: Provides a broader view of the intraday market, capturing larger moves.
Disadvantages: Fewer trading signals compared to lower time frames, but the signals are generally more reliable.
Factors to Consider When Choosing a Time Frame
Trading Style and Strategy:
Scalpers: Prefer lower time frames (1-minute to 5-minute) for quick, frequent trades.
Day Traders: Might use 5-minute to 30-minute charts to balance the need for detail and manageability.
Swing Traders: Could use 1-hour charts to capture larger price movements over the day.
Market Conditions:
In highly volatile markets, shorter time frames can be riskier due to increased noise and rapid price changes.
In stable markets, shorter time frames might be more manageable and provide clearer signals.
Experience and Comfort Level:
Less experienced traders might find lower time frames overwhelming due to the rapid pace and volume of data.
More experienced traders might handle lower time frames better, making quick decisions with confidence.
Availability:
If you cannot monitor the market constantly, higher time frames (e.g., 15-minute or 30-minute) may be more suitable, allowing for less frequent checks and adjustments.
Example: Intraday Trading with a 15-Minute Chart
Setup: Choose a liquid currency pair or stock with significant intraday movement.
Indicators: Use a combination of indicators such as moving averages, RSI, and MACD to identify trends and entry/exit points.
Entry: Wait for a clear signal (e.g., price crossing above a moving average with supporting indicators) on the 15-minute chart.
Stop-Loss and Take-Profit: Set a stop-loss below a recent support level and a take-profit at a logical resistance level or based on risk-reward ratio.
Execution: Place your trade and monitor the 15-minute chart for any significant changes that might warrant an adjustment or exit.
Conclusion
There is no single "best" time frame for intraday trading as it largely depends on your trading style, strategy, and comfort level. However, the 5-minute, 15-minute, and 30-minute charts are popular among day traders for balancing detail and manageability. Experiment with different time frames to see which one suits your trading style and provides you with the best results.