Trading Environment
In trading, market conditions can be broadly categorized into three types: trending up (bullish), trending down (bearish), and ranging (sideways). Each type represents a different pattern of price movement and has implications for trading strategies.
Trading Environment
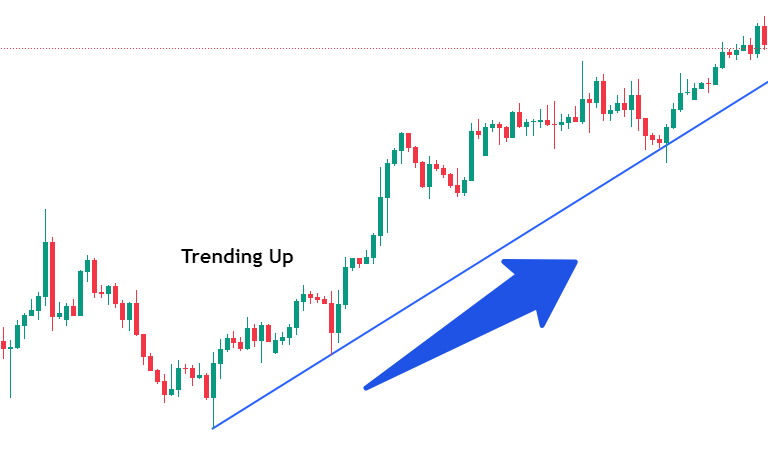
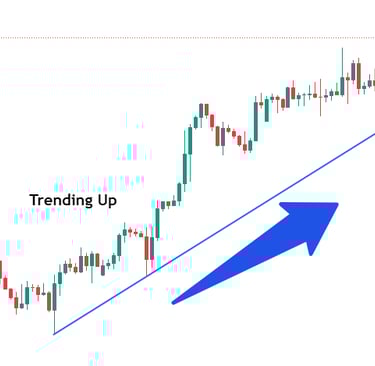
Trending Up (Bullish Market)
Definition: A market is said to be trending up when prices are consistently rising over a period of time.
Characteristics:
Higher highs and higher lows.
Upward sloping trendline.
Increased buying pressure.
Trading Strategies:
Buy and Hold: Investors buy assets and hold them expecting prices to rise further.
Trend Following: Traders use technical indicators like moving averages, trendlines, and momentum oscillators to identify entry points for buying during pullbacks.
Breakout Trading: Traders buy assets when prices break above significant resistance levels.


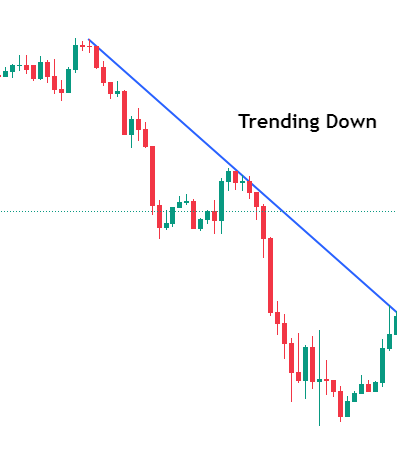
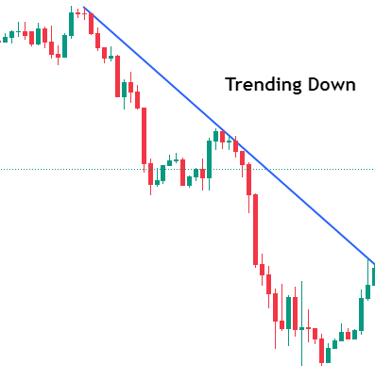
Trending Down (Bearish Market)
Definition: A market is trending down when prices are consistently falling over a period of time.
Characteristics:
Lower highs and lower lows.
Downward sloping trendline.
Increased selling pressure.
Trading Strategies:
Short Selling: Traders sell assets they do not own, intending to buy them back at lower prices.
Trend Following: Similar to bullish trends, but traders look for short-selling opportunities during rallies.
Breakdown Trading: Traders sell assets when prices break below significant support levels.
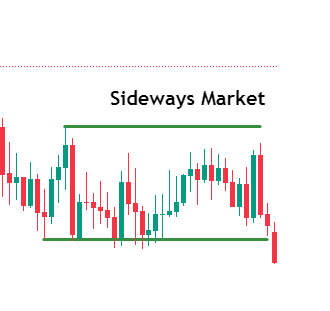
Ranging (Sideways Market)
Definition: A market is ranging when prices move within a horizontal band, without a clear upward or downward trend.
Characteristics:
Prices oscillate between a defined support level (bottom of the range) and a resistance level (top of the range).
Lack of clear direction.
Low volatility compared to trending markets.
Trading Strategies:
Range Trading: Traders buy at the support level and sell at the resistance level, capitalizing on the predictable price oscillations.
Mean Reversion: Traders assume prices will revert to the mean or average level within the range and trade accordingly.
Breakout Anticipation: Traders monitor the range for potential breakouts, positioning themselves to capitalize on a new trend when it emerges.
Understanding these market conditions helps traders to adapt their strategies accordingly. For instance, trend-following strategies work best in trending markets, while range trading strategies are more effective in ranging markets.

Identifying Reversals
A reversal indicates a significant change in the trend direction. Key tools and techniques to identify reversals include:
Technical Indicators:
Moving Average Crossovers: When a shorter-term moving average crosses above a longer-term moving average, it can signal a bullish reversal. Conversely, when it crosses below, it can indicate a bearish reversal.
Relative Strength Index (RSI): An RSI moving below 30 suggests the asset is oversold (potential bullish reversal), while an RSI above 70 suggests the asset is overbought (potential bearish reversal).
MACD (Moving Average Convergence Divergence): A crossover of the MACD line above the signal line indicates a bullish reversal, and a crossover below indicates a bearish reversal.
Candlestick Patterns:
Hammer and Hanging Man: A hammer at the bottom of a downtrend suggests a bullish reversal, while a hanging man at the top of an uptrend suggests a bearish reversal.
Engulfing Patterns: A bullish engulfing pattern, where a small bearish candle is followed by a larger bullish candle, indicates a potential bullish reversal. A bearish engulfing pattern, where a small bullish candle is followed by a larger bearish candle, indicates a potential bearish reversal.
Doji: A doji, especially after a prolonged trend, can signal indecision and a potential reversal.
Chart Patterns:
Head and Shoulders: A head and shoulders pattern at the top of an uptrend signals a bearish reversal, while an inverted head and shoulders pattern at the bottom of a downtrend signals a bullish reversal.
Double Tops and Double Bottoms: A double top pattern signals a bearish reversal, and a double bottom pattern signals a bullish reversal.
Volume Analysis:
Reversals often occur with a spike in volume, indicating strong participation and conviction in the new trend direction.
Reversals and Retracement
Identifying Retracements
A retracement is a temporary pullback within a larger trend. Key tools and techniques to identify retracements include:
Fibonacci Retracement Levels:
Common retracement levels are 23.6%, 38.2%, 50%, 61.8%, and 78.6%. These levels are used to identify potential support (in an uptrend) or resistance (in a downtrend) zones where the price might reverse back in the direction of the larger trend.
Trendlines:
Drawing trendlines connecting higher lows in an uptrend or lower highs in a downtrend can help identify the boundaries of a retracement.
Support and Resistance Levels:
Historical support and resistance levels can act as potential reversal points during a retracement.
Technical Indicators:
RSI: An RSI moving from overbought levels (above 70) back to more neutral levels can indicate a retracement in an uptrend. Conversely, an RSI moving from oversold levels (below 30) back to more neutral levels can indicate a retracement in a downtrend.
Bollinger Bands: Price moving towards the middle band from the upper band in an uptrend or from the lower band in a downtrend can signal a retracement.
Candlestick Patterns:
Inside Bars: An inside bar pattern, where a smaller bar is contained within the high and low range of the previous bar, can indicate a potential consolidation or retracement before the continuation of the trend.
Pin Bars: A pin bar with a long wick and a small body can indicate rejection of lower or higher prices, signaling the end of a retracement.
By combining these tools and techniques, traders can more effectively identify reversals and retracements, allowing them to make better trading decisions.
Market volatility
Market volatility refers to the degree of variation in the price of a financial instrument over time. High volatility indicates large price swings and significant price changes, while low volatility indicates smaller price swings and more stable prices. Volatility is a critical concept for traders and investors as it affects risk levels, potential returns, and market behavior.
Market volatility
How to Measure Market Volatility
Standard Deviation:
Definition: Standard deviation measures the dispersion of a set of data points (in this case, asset prices) from their mean. A higher standard deviation indicates greater volatility.
Calculation: It involves computing the average price, then finding the squared differences between each price and the average, averaging those squared differences, and finally taking the square root of that average.
Variance:
Definition: Variance is the square of the standard deviation and provides a measure of how spread out the prices are around the mean.
Calculation: Similar to standard deviation but without taking the square root at the end.
Beta:
Definition: Beta measures the volatility of an asset relative to the overall market. A beta greater than 1 indicates higher volatility than the market, while a beta less than 1 indicates lower volatility.
Calculation: Beta is typically calculated through regression analysis comparing the returns of the asset to the returns of a benchmark index.
Historical Volatility:
Definition: Historical volatility (HV) is the measure of how much the price of an asset has fluctuated in the past.
Calculation: It's usually calculated using standard deviation based on historical price data over a specific period (e.g., 30 days, 90 days).
Implied Volatility:
Definition: Implied volatility (IV) represents the market's forecast of a likely movement in an asset's price. It's derived from the prices of options on the asset.
Calculation: Implied volatility is not directly observable but is derived from options pricing models like the Black-Scholes model. It reflects the market's expectations of future volatility.
Average True Range (ATR):
Definition: ATR measures the average range of price movements over a specified period, capturing both the high-low range and any gaps between trading sessions.
Calculation: The ATR is the average of the true ranges over a specified period, where the true range is the greatest of the following: the current high minus the current low, the absolute value of the current high minus the previous close, and the absolute value of the current low minus the previous close.
Volatility Index (VIX):
Definition: Often referred to as the "fear gauge," the VIX measures the market's expectation of 30-day volatility, derived from the implied volatilities of a wide range of S&P 500 index options.
Calculation: The VIX is calculated using the midpoint of real-time S&P 500 index option bid and ask prices.
Practical Steps to Measure Volatility
Using Standard Deviation
Gather historical price data: Collect daily closing prices for the asset over the period you want to measure.
Calculate the mean (average) price: Sum all the closing prices and divide by the number of days.
Compute each day's deviation from the mean: Subtract the mean price from each day's closing price.
Square each deviation: Multiply each deviation by itself to get the squared deviation.
Calculate the average of these squared deviations: Sum all the squared deviations and divide by the number of days (or by the number of days minus one for sample standard deviation).
Take the square root of this average: The result is the standard deviation.
Using ATR
Calculate the true range (TR) for each day: The greatest of the following: current high minus current low, the absolute value of current high minus previous close, and the absolute value of current low minus previous close.
Average the true ranges over the period: Sum the true ranges for the chosen period and divide by the number of periods
Tools and Software
Excel or Spreadsheet Software: Useful for manual calculations and visualizing volatility.
Trading Platforms: Many platforms like MetaTrader, ThinkorSwim, and TradingView have built-in indicators for standard deviation, ATR, and other volatility measures.
Financial Websites and Analytics Tools: Websites like Yahoo Finance, Bloomberg, and Investing.com provide historical volatility data, beta values, and implied volatility figures.
By understanding and measuring volatility, traders can better assess risk, choose appropriate trading strategies, and make informed decisions.