Pivot Points
Pivot points trading is a popular strategy used in technical analysis that involves identifying potential support and resistance levels in a financial market. Pivot points are calculated based on the high, low, and close prices of the previous trading period (e.g., day, week, or month). These levels can help traders anticipate potential market turning points, where the price may experience a reversal or breakout.
Pivot Points
How Pivot Points Are Calculated
The calculation for a pivot point is shown below:
Pivot point (PP) = (High + Low + Close) / 3
Support and resistance levels are then calculated off the pivot point like so:
First resistance (R1) = (2 x PP) – Low
First support (S1) = (2 x PP) – High
Second resistance (R2) = PP + (High – Low)
Second support (S2) = PP – (High – Low)
Third resistance (R3) = High + 2(PP – Low)
Third support (S3) = Low – 2(High – PP)
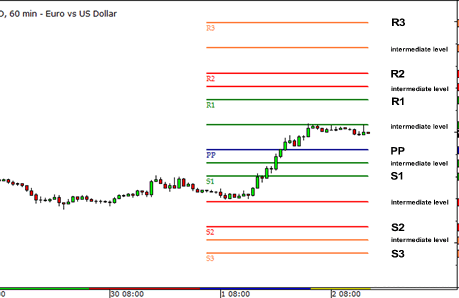
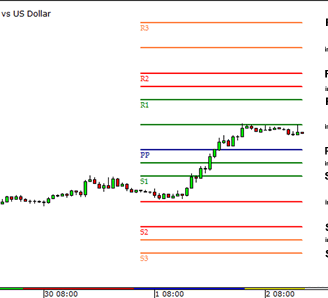
Keep in mind that some forex charting software plots intermediate levels or mid-point levels.
Trading with pivot points
Trading with pivot points involves using these key levels as potential areas of support and resistance to make trading decisions. Here's a step-by-step guide on how to trade using pivot points:
1. Identify Pivot Points and Levels
Calculate the pivot point (P) and associated support (S1, S2, S3) and resistance (R1, R2, R3) levels using the high, low, and close prices of the previous trading period.
2. Analyze Market Conditions
Before making any trades, analyze the overall market conditions to determine whether the market is trending or range-bound.
3. Trading Strategies
A. Range Trading
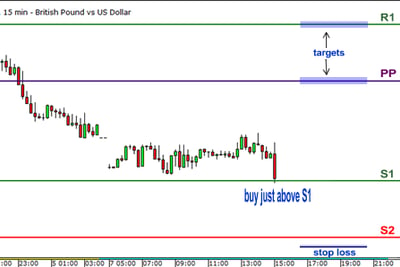
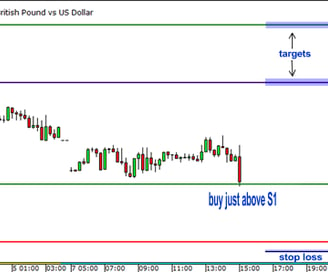
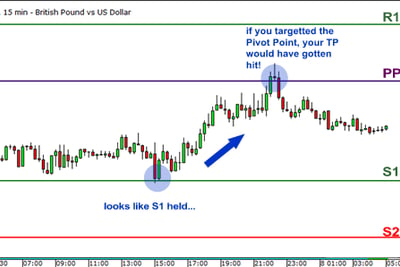
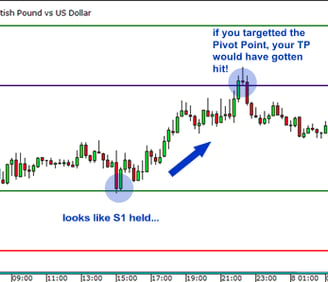
Buy near support levels (S1, S2, S3): In a range-bound market, if the price approaches a support level and shows signs of bouncing back up, consider entering a long position.
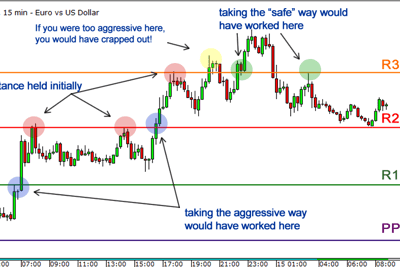
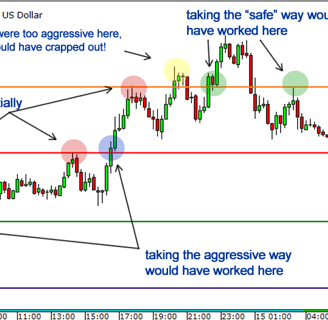
Sell near resistance levels (R1, R2, R3): Conversely, if the price approaches a resistance level and shows signs of reversing downward, consider entering a short position.
B. Breakout Trading
Buy on a breakout above resistance levels (R1, R2, R3): If the price breaks above a resistance level with strong momentum, it may indicate the start of an uptrend. Enter a long position.
Sell on a breakdown below support levels (S1, S2, S3): If the price breaks below a support level with strong momentum, it may indicate the start of a downtrend. Enter a short position.
C. Trend Identification
In an uptrend: Look for buying opportunities near the pivot point or support levels (S1, S2) if the price is above the pivot point.
In a downtrend: Look for selling opportunities near the pivot point or resistance levels (R1, R2) if the price is below the pivot point.
4. Confirmation
Use additional technical indicators and tools to confirm signals provided by pivot points. Common indicators include moving averages, RSI, MACD, and candlestick patterns.
5. Risk Management
Implement proper risk management techniques to protect your capital:
Set stop-loss orders: Place stop-loss orders below the support level for long positions and above the resistance level for short positions.
Position sizing: Determine the size of your position based on your risk tolerance and the distance to your stop-loss level.
Understanding Market Sentiment with Pivot Points
Pivot Point as a Sentiment Indicator:
Above Pivot Point (P): If the price is trading above the pivot point, it indicates bullish sentiment. Traders are generally more optimistic, and there’s a higher likelihood of upward price movement.
Below Pivot Point (P): If the price is trading below the pivot point, it indicates bearish sentiment. Traders are generally more pessimistic, and there’s a higher likelihood of downward price movement.
Support and Resistance Levels:
Support Levels (S1, S2, S3): If the price is approaching or bouncing off support levels, it suggests that these levels are holding, reinforcing bullish sentiment.
Resistance Levels (R1, R2, R3): If the price is approaching or bouncing off resistance levels, it suggests that these levels are holding, reinforcing bearish sentiment.
Using Pivot Points to Trade Market Sentiment
Identifying Bullish Sentiment:
Price above Pivot Point: When the price is consistently above the pivot point, it shows bullish sentiment. Consider looking for long positions.
Price breaks above Resistance Levels (R1, R2, R3): A breakout above these levels can indicate strong bullish momentum and further upside potential.
Identifying Bearish Sentiment:
Price below Pivot Point: When the price is consistently below the pivot point, it shows bearish sentiment. Consider looking for short positions.
Price breaks below Support Levels (S1, S2, S3): A breakdown below these levels can indicate strong bearish momentum and further downside potential.
Summary
Trading with pivot points involves using calculated support and resistance levels to make informed trading decisions. By combining pivot points with market analysis, confirmation from other indicators, and robust risk management, traders can improve their chances of successful trades.