Elliott Wave Theory
Elliott Wave Theory is a form of technical analysis that traders use to analyze financial market cycles and forecast future price movements. Developed by Ralph Nelson Elliott in the 1930s, the theory is based on the idea that market prices unfold in specific patterns or "waves" that are driven by investor psychology and sentiment.
Elliott Wave Theory
Core Principles of Elliott Wave Theory
Wave Patterns:
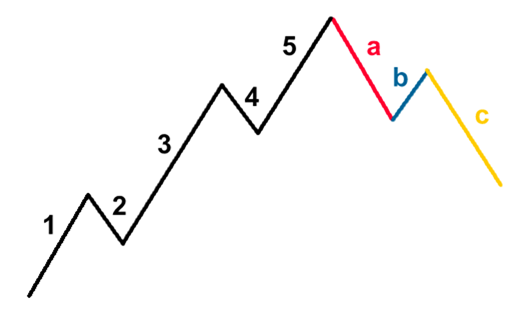
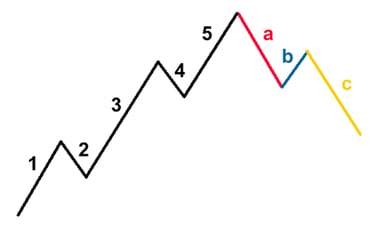
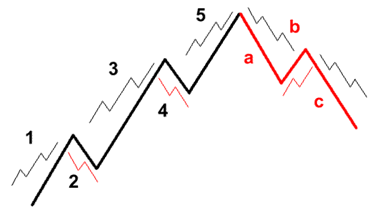
Impulse Waves: These consist of five waves (1, 2, 3, 4, 5) that move in the direction of the primary trend. Waves 1, 3, and 5 are motive waves, moving with the trend, while waves 2 and 4 are corrective waves, moving against the trend.
Corrective Waves: These consist of three waves (A, B, C) that move against the primary trend. Corrective waves can take various forms, including zigzags, flats, and triangles.
Wave Degrees:
Elliott Wave Theory operates on multiple degrees of waves, meaning smaller wave patterns form within larger wave patterns. These degrees range from very long-term "Grand Supercycle" waves to very short-term "Subminuette" waves.
Fractals:
Market movements are fractal, meaning patterns observed on a smaller scale can be observed on a larger scale.
Rules and Guidelines
Wave 2: Cannot retrace more than 100% of Wave 1.
Wave 3: Cannot be the shortest of the three impulse waves (Waves 1, 3, and 5) and is usually the longest.
Wave 4: Cannot overlap the price territory of Wave 1 except in special cases (like diagonal triangles).
Using Elliott Wave Theory in Trading
Traders use Elliott Wave Theory to identify the direction and potential reversal points of market trends. Here's how it is applied in trading:
Identifying Wave Patterns:
Traders identify the current position of the market within the Elliott Wave cycle. For example, recognizing whether the market is in an impulse or corrective wave helps determine the trading strategy.
Entry and Exit Points:
Buying Opportunities: Traders often enter long positions at the beginning of Wave 3 or Wave 5 of an impulse wave.
Selling Opportunities: Traders may enter short positions at the beginning of Wave A of a corrective wave.
Setting Targets:
Fibonacci retracement and extension levels are often used to set price targets within the wave patterns. For example, the end of Wave 3 often aligns with the 161.8% Fibonacci extension of Wave 1.
Stop-Loss Placement:
Traders place stop-loss orders based on wave rules, such as below the start of Wave 1 in a bullish market or above the start of Wave 1 in a bearish market.
Practical Tips
Combine with Other Analysis: Use Elliott Wave Theory in conjunction with other technical indicators (e.g., RSI, MACD) to confirm wave counts and potential reversals.
Stay Flexible: Be prepared to adjust wave counts as new price information becomes available. Market waves can be complex and sometimes tricky to interpret.
Practice and Patience: Mastery of Elliott Wave Theory requires practice and experience. Regularly analyzing charts and practicing wave counts can improve your ability to apply the theory effectively.
Summary
Elliott Wave Theory provides a structured way to analyze market trends and potential reversal points by identifying repeating wave patterns driven by investor sentiment. By understanding and applying these principles, traders can enhance their market forecasts and make more informed trading decisions.
Types of corrective wave in Elliot wave theory
In Elliott Wave Theory, corrective waves move against the direction of the larger trend and typically unfold in three primary patterns: zigzags, flats, and triangles. Each of these patterns has its own characteristics and variations. Here’s a detailed overview of each type of corrective wave:
1. Zigzags (5-3-5 Structure)
A zigzag is a sharp correction that moves strongly against the trend. It consists of three waves: an initial impulse wave (A), a corrective wave (B), and another impulse wave (C).
Wave A: This wave is composed of five sub-waves moving in the direction of the correction.
Wave B: This wave is composed of three sub-waves and retraces part of Wave A.
Wave C: This wave is composed of five sub-waves and moves beyond the end of Wave A.
Variations:
Single Zigzag: A single three-wave pattern (A-B-C).
Double Zigzag (W-X-Y): Consists of two zigzags connected by a corrective wave (X).
Triple Zigzag (W-X-Y-X-Z): Consists of three zigzags connected by two corrective waves (X).
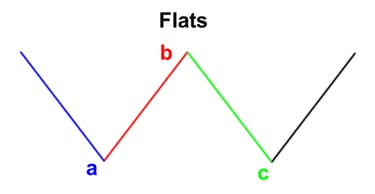
2. Flats (3-3-5 Structure)
A flat is a sideways correction that typically moves less sharply than a zigzag. It consists of three waves: an initial corrective wave (A), a corrective wave (B), and an impulse wave (C).
Wave A: This wave is composed of three sub-waves and is corrective.
Wave B: This wave is also composed of three sub-waves and usually retraces close to or beyond the start of Wave A.
Wave C: This wave is composed of five sub-waves and moves beyond the end of Wave A.
Types of Flats:
Regular Flat: Wave B ends around the start of Wave A, and Wave C ends slightly beyond the end of Wave A.
Expanded Flat: Wave B ends beyond the start of Wave A, and Wave C ends significantly beyond the end of Wave A.
Running Flat: Wave B ends beyond the start of Wave A, but Wave C does not end beyond the end of Wave A.
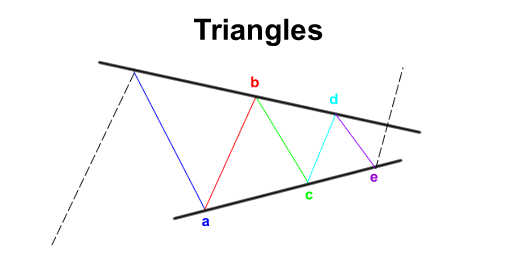
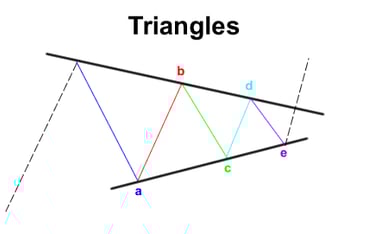
3. Triangles (3-3-3-3-3 Structure)
A triangle is a consolidation pattern that consists of five waves moving sideways. Each wave in a triangle subdivides into three smaller waves.
Types of Triangles:
Ascending Triangle: A triangle with a horizontal top boundary and an upward sloping lower boundary.
Descending Triangle: A triangle with a horizontal lower boundary and a downward sloping upper boundary.
Symmetrical Triangle: A triangle with converging trendlines, where both the upper and lower boundaries slope towards each other.
Expanding Triangle: A triangle with diverging trendlines, where both the upper and lower boundaries slope away from each other.
Contracting Triangle: The most common type, where both boundaries slope towards each other, forming a pattern that narrows over time.

Waves Inside Waves
Elliott Wave Theory posits that financial markets move in repetitive cycles or "waves" driven by collective investor psychology. One of the core principles of this theory is the fractal nature of markets, meaning that smaller wave patterns form within larger wave patterns. This concept is known as "waves within waves." Here’s a detailed breakdown:

Hierarchical Structure of Elliott Waves
Elliott Wave Theory categorizes waves into different degrees, from very large "Grand Supercycle" waves to very small "Subminuette" waves. Each wave can be broken down into smaller waves, and these smaller waves can be broken down further, creating a nested structure.
Degrees of Waves
Here’s a typical classification of wave degrees from largest to smallest:
Grand Supercycle
Supercycle
Cycle
Primary
Intermediate
Minor
Minute
Minuette
Subminuette
Impulse Waves and Corrective Waves
Impulse Waves (Motive Waves):
Impulse waves move in the direction of the larger trend.
They consist of five sub-waves: three motive waves (1, 3, and 5) and two corrective waves (2 and 4).
Waves 1, 3, and 5 are themselves impulse waves and subdivide into five smaller waves.
Waves 2 and 4 are corrective waves and subdivide into three smaller waves.
Corrective Waves:
Corrective waves move against the direction of the larger trend.
They consist of three sub-waves (A, B, and C).
Each wave in a corrective pattern (zigzag, flat, triangle) can also be broken down into smaller waves.
Example of Waves Within Waves
Let's consider a bullish market scenario:
Primary Degree:
Wave 1: Consists of five smaller waves (Intermediate degree).
Wave 2: Consists of three smaller waves (Intermediate degree).
Wave 3: Consists of five smaller waves (Intermediate degree).
Wave 4: Consists of three smaller waves (Intermediate degree).
Wave 5: Consists of five smaller waves (Intermediate degree).
Intermediate Degree:
Within Wave 1 (Primary):
Wave 1: Consists of five Minor degree waves.
Wave 2: Consists of three Minor degree waves.
Wave 3: Consists of five Minor degree waves.
Wave 4: Consists of three Minor degree waves.
Wave 5: Consists of five Minor degree waves.
Application in Trading
Identifying Larger Trend:
Traders start by identifying the larger trend and the primary degree waves to understand the market’s general direction.
Drilling Down:
Traders then drill down to smaller degrees (e.g., Intermediate, Minor) to find more precise entry and exit points.
Confirming Wave Patterns:
By identifying waves within waves, traders can confirm whether the market is behaving as expected according to Elliott Wave Theory.
Using Multiple Timeframes:
Traders use multiple timeframes to analyze different wave degrees. For instance, a monthly chart might show primary waves, while a daily chart might show intermediate waves.
Practical Example
Suppose you identify a Wave 3 on a daily chart (Primary degree):
Switch to a lower timeframe, such as a 4-hour chart, to analyze the structure of Wave 3.
You observe that Wave 3 on the daily chart consists of five intermediate waves.
Further, switch to an hourly chart to analyze one of these intermediate waves and observe its minor wave structure.
By doing so, you can pinpoint more accurate entry and exit points, confirming that you are trading in line with the larger trend.
Summary
Elliott Wave Theory’s concept of "waves within waves" provides a detailed and hierarchical structure for analyzing market movements. Each wave, regardless of its degree, consists of smaller waves that follow similar patterns, allowing traders to analyze markets on multiple timeframes and degrees. This fractal nature helps in making more precise and informed trading decisions by identifying patterns within larger market trends.
How to Apply Elliott Wave Theory in Real Market
Applying Elliott Wave Theory in the real market involves several steps, from identifying the wave patterns to making trading decisions based on these patterns. Here’s a step-by-step guide to help you implement Elliott Wave Theory in your trading:
Step 1: Understand the Basics of Elliott Wave Theory
Before applying Elliott Wave Theory, ensure you have a solid understanding of its principles:
Impulse waves consist of five waves (1, 2, 3, 4, 5) moving in the direction of the trend.
Corrective waves consist of three waves (A, B, C) moving against the trend.
Waves within waves: Each wave can be broken down into smaller waves, following the same impulse and corrective patterns.
Step 2: Select the Right Chart and Timeframe
Choose a chart and timeframe that aligns with your trading strategy:
Long-term investors might use weekly or monthly charts to identify primary and cycle degree waves.
Short-term traders might use daily, 4-hour, or hourly charts to identify intermediate, minor, and minute degree waves.
Step 3: Identify the Overall Trend
Begin by identifying the overall trend in the market. Look for clear patterns that suggest whether the market is in an uptrend or downtrend.
Step 4: Identify Impulse and Corrective Waves
Use the following techniques to identify impulse and corrective waves:
Identify Major Waves:
Look for five-wave patterns (impulse) in the direction of the trend.
Identify three-wave patterns (corrective) against the trend.
Validate Wave Patterns:
Ensure the wave patterns follow the rules of Elliott Wave Theory:
Wave 2 should not retrace more than 100% of Wave 1.
Wave 3 should not be the shortest wave and is usually the longest.
Wave 4 should not overlap the price territory of Wave 1 (except in diagonal triangles).
Step 5: Use Fibonacci Ratios
Use Fibonacci retracement and extension levels to predict the end of corrective waves and the potential target for impulse waves:
Retracement Levels: Common retracement levels are 38.2%, 50%, and 61.8%.
Extension Levels: Common extension levels are 161.8%, 200%, and 261.8%.
Step 6: Confirm with Technical Indicators
Confirm your wave counts and potential turning points with additional technical indicators:
Relative Strength Index (RSI): To identify overbought or oversold conditions.
Moving Averages: To identify the overall trend and potential support/resistance levels.
MACD (Moving Average Convergence Divergence): To identify momentum and trend changes.
Step 7: Make Trading Decisions
Based on your wave analysis, make trading decisions:
Entry Points:
Enter long positions at the beginning of Waves 3 or 5 in an uptrend.
Enter short positions at the beginning of Waves A or C in a downtrend.
Stop-Loss Placement:
Place stop-loss orders below the start of Wave 1 for long positions.
Place stop-loss orders above the start of Wave 1 for short positions.
Profit Targets:
Set profit targets near the end of Wave 3 or Wave 5 for impulse waves.
Set profit targets near the end of Wave C for corrective waves.
Step 8: Monitor and Adjust
Continuously monitor the market and adjust your wave counts as new price data emerges:
Be flexible and ready to reevaluate your wave analysis if the market does not behave as expected.
Update your wave counts and adjust your trading plan accordingly.
Practical Example
Let's apply these steps to a hypothetical market scenario:
Overall Trend:
Identify that the market is in an uptrend on a daily chart.
Impulse Waves:
Identify five waves moving upward (1, 2, 3, 4, 5).
Corrective Waves:
Identify a three-wave correction (A, B, C) following the impulse waves.
Fibonacci Ratios:
Use Fibonacci retracement to predict the end of Wave 2 (38.2%, 50%, 61.8% levels).
Use Fibonacci extension to predict the target for Wave 3 (161.8%, 200% levels).
Technical Indicators:
Use RSI to confirm that the market is not overbought at the beginning of Wave 3.
Use MACD to confirm the bullish momentum.
Trade Execution:
Enter a long position at the start of Wave 3.
Place a stop-loss order below the start of Wave 1.
Set a profit target near the predicted end of Wave 3.
Monitor and Adjust:
Monitor the market for any deviations from your wave count.
Adjust your analysis and trading plan as needed.
Summary
Applying Elliott Wave Theory in real markets involves understanding the theory’s principles, selecting the appropriate chart and timeframe, identifying wave patterns, using Fibonacci ratios, confirming with technical indicators, making informed trading decisions, and continuously monitoring and adjusting your analysis. By following these steps, traders can use Elliott Wave Theory to enhance their market analysis and improve their trading outcomes.