Harmonic price patterns are specific formations that occur in financial markets, used by traders to predict future price movements based on geometric patterns and Fibonacci numbers. These patterns, developed by H.M. Gartley and later refined by Scott Carney and others, identify potential reversal points in the market
Harmonic price patterns
Primary harmonic patterns
ABCD Pattern
Three-Drive Pattern
Gartley Pattern
Crab Pattern
Bat Pattern
Butterfly Pattern
ABCD Pattern
The ABCD pattern is one of the simplest and most common harmonic patterns used in trading. It is a continuation pattern that identifies potential reversal points in the market. The pattern consists of four points (A, B, C, and D) and three legs (AB, BC, and CD), forming a zigzag shape.
Structure and Key Characteristics
Point A to B (AB Leg):
This is the initial move in the pattern.
Can be either an upward or downward move.
Point B to C (BC Leg):
This is a retracement of the AB leg.
Common Fibonacci retracement levels for BC are 61.8%, 50%, or 38.2% of the AB leg.
Point C to D (CD Leg):
This leg extends in the same direction as the AB leg.
CD is typically equal to AB, making AB = CD.
Alternatively, CD can be a 127.2% or 161.8% Fibonacci extension of BC.

How to Trade the ABCD Pattern
Identification:
Identify points A, B, C, and D on the price chart.
Ensure the pattern follows the typical Fibonacci retracement and extension levels.
Entry Point:
Enter a trade at point D, where the pattern completes.
This is based on the expectation that the price will reverse direction at point D.
Stop-Loss Placement:
Place a stop-loss order slightly beyond point D to manage risk.
This helps protect against the pattern failing and the price continuing in the same direction.
Profit Targets:
Set profit targets based on key Fibonacci retracement levels of the CD leg.
Common profit targets include the 38.2%, 50%, and 61.8% retracement levels of the CD leg.
Example
Let's say the price moves from point A to point B, then retraces to point C, and finally extends to point D:
AB Leg: Price moves up from $100 to $110.
BC Leg: Price retraces to $105, which is a 50% retracement of the AB leg.
CD Leg: Price moves up again to $115, matching the length of AB.
Here, the pattern completes at point D ($115), where a trader would look to enter a short position expecting a reversal.
Summary
The ABCD pattern is a straightforward yet powerful tool in harmonic trading. By identifying the pattern's structure and following the key Fibonacci levels, traders can make informed decisions about potential entry and exit points in the market. This pattern helps in predicting market reversals with a relatively simple setup.
Three-Drive Pattern
The Three-Drive Pattern is a harmonic chart pattern used in technical analysis to identify potential market reversals. It consists of three consecutive price movements or "drives," each followed by a corrective move, and it relies heavily on Fibonacci ratios to confirm the pattern's validity. Here’s a brief overview:
Structure and Key Characteristics
Three Drives:
The pattern comprises three distinct price movements (Drive 1, Drive 2, and Drive 3), all moving in the same direction (either up or down).
Fibonacci Relationships:
Each drive is typically followed by a corrective move that retraces a Fibonacci percentage of the previous drive.
Common retracement levels are 61.8% or 78.6% of the previous drive.
Symmetry:
The time taken for each drive and the subsequent corrective move is often similar, creating a symmetrical pattern.
Identifying the Pattern
Drive 1:
The initial price movement starts the pattern.
Followed by a corrective move retracing 61.8% or 78.6% of Drive 1.
Drive 2:
The price moves again in the direction of Drive 1, forming Drive 2.
Drive 2 typically extends to 127.2% or 161.8% of the length of Drive 1.
Followed by a corrective move retracing 61.8% or 78.6% of Drive 2.
Drive 3:
The price moves in the same direction as Drives 1 and 2, forming Drive 3.
Drive 3 usually extends to 127.2% or 161.8% of the length of Drive 2.
How to Trade the Three-Drive Pattern
Identification:
Identify the three consecutive price movements and ensure each corrective move aligns with the expected Fibonacci retracements.
Confirm that each drive extends to the appropriate Fibonacci extension levels.
Entry Point:
Enter a trade at the completion of Drive 3, where a reversal is expected.
For a bearish pattern (downward drives), consider a long position; for a bullish pattern (upward drives), consider a short position.
Stop-Loss Placement:
Place a stop-loss order beyond the start of Drive 3 to manage risk.
This helps protect against the pattern failing and the price continuing in the same direction.
Profit Targets:
Set profit targets based on key Fibonacci retracement levels of the overall pattern.
Common targets include the 38.2%, 50%, and 61.8% retracement levels of the entire pattern.
Example
Let's consider a bullish Three-Drive pattern (price is expected to move up):
Drive 1: Price moves up from $100 to $110.
Correction: Price retraces to $104, which is a 61.8% retracement of Drive 1.
Drive 2: Price moves up again to $118, which is 127.2% of Drive 1.
Correction: Price retraces to $111.6, a 61.8% retracement of Drive 2.
Drive 3: Price moves up to $130, which is 127.2% of Drive 2.
At this point, the pattern completes, and traders expect a reversal.
Summary
The Three-Drive Pattern is a powerful harmonic pattern used to predict market reversals based on a series of three consecutive price movements and their Fibonacci relationships. By identifying the pattern and following the associated Fibonacci levels, traders can make informed decisions about potential entry and exit points in the market. This pattern helps traders anticipate market reversals with a relatively simple setup, relying on the symmetrical nature and Fibonacci retracements and extensions.

The Gartley Pattern
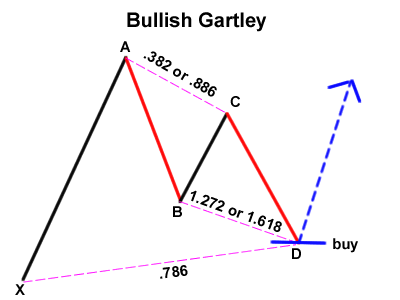
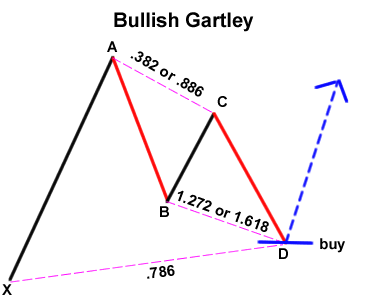
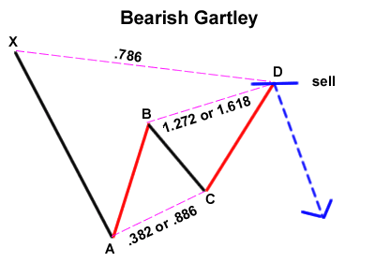
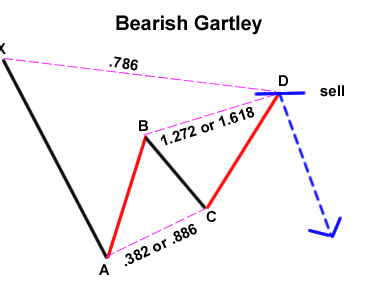
The Gartley Pattern is a harmonic chart pattern used in technical analysis to identify potential reversal points in the market. It was first introduced by H.M. Gartley in his book "Profits in the Stock Market" in 1935 and later popularized by Scott Carney. The pattern is characterized by a specific structure and Fibonacci retracement levels.
Structure and Key Characteristics
X-A Move:
The initial price move (either up or down).
A-B Move:
A retracement of 61.8% of the X-A move.
B-C Move:
A retracement of 38.2% to 88.6% of the A-B move.
C-D Move:
An extension of 127.2% to 161.8% of the B-C move.
Completes at 78.6% retracement of the X-A move.
Identification
X-A Leg:
Identify the initial price movement.
A-B Leg:
Measure the retracement of the X-A leg, which should be 61.8%.
B-C Leg:
Measure the retracement of the A-B leg, which should be between 38.2% and 88.6%.
C-D Leg:
Measure the extension of the B-C leg, which should be between 127.2% and 161.8%.
The pattern completes at the 78.6% retracement of the X-A leg.
How to Trade the Gartley Pattern
Entry Point:
Enter a trade at point D, where the pattern completes and a reversal is expected.
For a bullish Gartley (X-A down), enter a long position.
For a bearish Gartley (X-A up), enter a short position.
Stop-Loss Placement:
Place a stop-loss order beyond point D to manage risk.
This helps protect against the pattern failing and the price continuing in the same direction.
Profit Targets:
Set profit targets based on Fibonacci retracement levels of the C-D leg or previous significant highs/lows.
Common targets include the 38.2%, 50%, and 61.8% retracement levels of the C-D leg.
Example
Consider a bullish Gartley pattern (expecting an upward reversal):
X-A Leg: Price moves down from $100 to $80.
A-B Leg: Price retraces up to $90 (61.8% retracement of X-A).
B-C Leg: Price retraces down to $85 (38.2% to 88.6% retracement of A-B).
C-D Leg: Price extends down to $75 (127.2% to 161.8% extension of B-C and 78.6% retracement of X-A).
At point D ($75), the pattern completes, and a trader would look to enter a long position expecting a reversal.
Summary
The Gartley Pattern is a harmonic pattern used to predict market reversals based on specific Fibonacci retracement and extension levels. By identifying the structure and following the key levels, traders can make informed decisions about potential entry and exit points in the market. This pattern helps in anticipating market reversals with a relatively high degree of accuracy.
The Crab Pattern
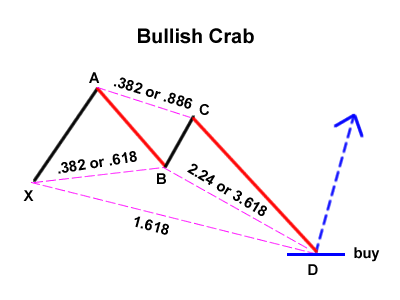
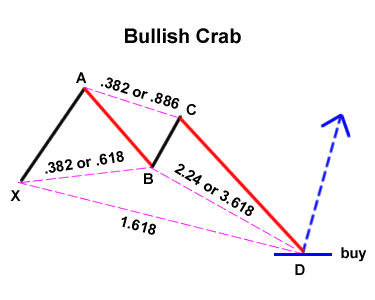
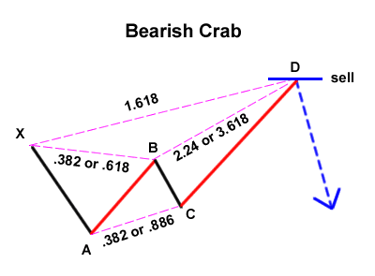
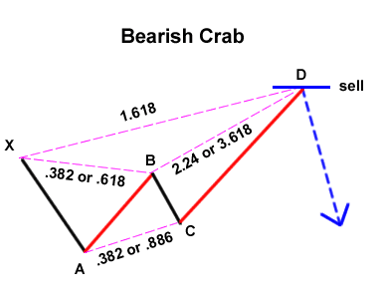
The Crab Pattern is a harmonic chart pattern used in technical analysis to identify potential reversal points in the market. It was introduced by Scott Carney and is known for its precise Fibonacci ratios and deeper retracement levels compared to other harmonic patterns. The Crab Pattern typically signals a significant price reversal when it completes.
Structure and Key Characteristics
X-A Move:
The initial price move, which can be either upward or downward.
A-B Move:
A retracement of 38.2% to 61.8% of the X-A move.
B-C Move:
A retracement of 38.2% to 88.6% of the A-B move.
C-D Move:
An extension of 224% to 361.8% of the B-C move.
Completes at a 161.8% extension of the X-A move.
Identification
X-A Leg:
Identify the initial significant price movement.
A-B Leg:
Measure the retracement of the X-A leg, which should be between 38.2% and 61.8%.
B-C Leg:
Measure the retracement of the A-B leg, which should be between 38.2% and 88.6%.
C-D Leg:
Measure the extension of the B-C leg, which should be between 224% and 361.8%.
Ensure the C-D leg also completes at a 161.8% extension of the X-A leg.
How to Trade the Crab Pattern
Entry Point:
Enter a trade at point D, where the pattern completes and a reversal is expected.
For a bullish Crab (X-A down), enter a long position.
For a bearish Crab (X-A up), enter a short position.
Stop-Loss Placement:
Place a stop-loss order beyond point D to manage risk.
This helps protect against the pattern failing and the price continuing in the same direction.
Profit Targets:
Set profit targets based on Fibonacci retracement levels of the C-D leg or previous significant highs/lows.
Common targets include the 38.2%, 50%, and 61.8% retracement levels of the C-D leg.
Example
Consider a bullish Crab pattern (expecting an upward reversal):
X-A Leg: Price moves down from $100 to $80.
A-B Leg: Price retraces up to $90 (38.2% to 61.8% retracement of X-A).
B-C Leg: Price retraces down to $85 (38.2% to 88.6% retracement of A-B).
C-D Leg: Price extends down to $65 (224% to 361.8% extension of B-C and 161.8% extension of X-A).
At point D ($65), the pattern completes, and a trader would look to enter a long position expecting a reversal.
Summary
The Crab Pattern is a precise harmonic pattern used to predict market reversals based on specific Fibonacci retracement and extension levels. By identifying the structure and following the key levels, traders can make informed decisions about potential entry and exit points in the market. This pattern helps in anticipating significant market reversals with a high degree of accuracy.
The Bat Pattern
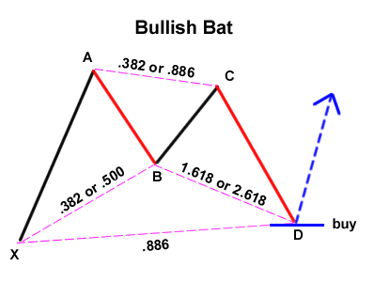
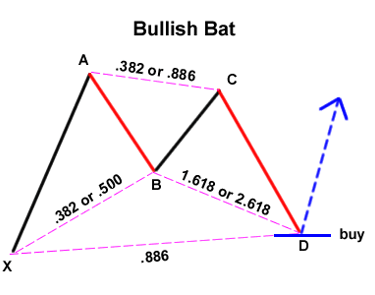
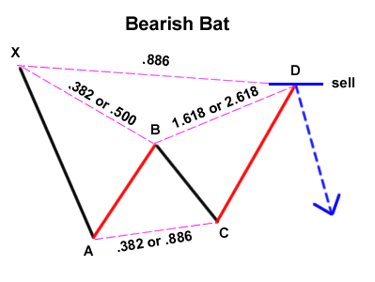
The Bat Pattern is a harmonic chart pattern used in technical analysis to identify potential market reversals. It was introduced by Scott Carney and is characterized by its specific Fibonacci retracement and extension levels. The Bat Pattern is known for its precision and conservative approach compared to other harmonic patterns.
Structure and Key Characteristics
X-A Move:
The initial price move, which can be either upward or downward.
A-B Move:
A retracement of 38.2% to 50% of the X-A move.
B-C Move:
A retracement of 38.2% to 88.6% of the A-B move.
C-D Move:
An extension of 161.8% to 261.8% of the B-C move.
Completes at an 88.6% retracement of the X-A move.
Identification
X-A Leg:
Identify the initial significant price movement.
A-B Leg:
Measure the retracement of the X-A leg, which should be between 38.2% and 50%.
B-C Leg:
Measure the retracement of the A-B leg, which should be between 38.2% and 88.6%.
C-D Leg:
Measure the extension of the B-C leg, which should be between 161.8% and 261.8%.
Ensure the C-D leg also completes at an 88.6% retracement of the X-A leg.
How to Trade the Bat Pattern
Entry Point:
Enter a trade at point D, where the pattern completes and a reversal is expected.
For a bullish Bat (X-A down), enter a long position.
For a bearish Bat (X-A up), enter a short position.
Stop-Loss Placement:
Place a stop-loss order beyond point D to manage risk.
This helps protect against the pattern failing and the price continuing in the same direction.
Profit Targets:
Set profit targets based on Fibonacci retracement levels of the C-D leg or previous significant highs/lows.
Common targets include the 38.2%, 50%, and 61.8% retracement levels of the C-D leg.
Example
Consider a bullish Bat pattern (expecting an upward reversal):
X-A Leg: Price moves down from $100 to $80.
A-B Leg: Price retraces up to $90 (38.2% to 50% retracement of X-A).
B-C Leg: Price retraces down to $85 (38.2% to 88.6% retracement of A-B).
C-D Leg: Price extends down to $75 (161.8% to 261.8% extension of B-C and 88.6% retracement of X-A).
At point D ($75), the pattern completes, and a trader would look to enter a long position expecting a reversal.
Summary
The Bat Pattern is a harmonic pattern used to predict market reversals based on specific Fibonacci retracement and extension levels. By identifying the structure and following the key levels, traders can make informed decisions about potential entry and exit points in the market. This pattern helps in anticipating market reversals with a relatively high degree of accuracy, making it a valuable tool for traders.
Butterfly Pattern
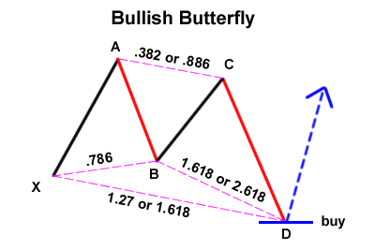
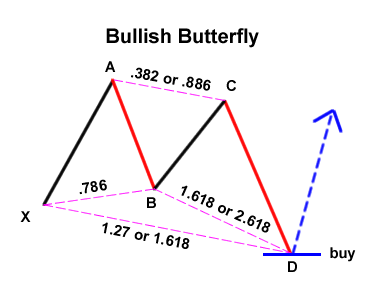
The Butterfly Pattern is a harmonic chart pattern used in technical analysis to identify potential market reversal points. It was introduced by Bryce Gilmore and further popularized by Scott Carney. The Butterfly Pattern is distinguished by its specific Fibonacci ratios and is known for predicting sharp reversals with precise entry points.
Structure and Key Characteristics
X-A Move:
The initial price move, which can be either upward or downward.
A-B Move:
A retracement of 78.6% of the X-A move.
B-C Move:
A retracement of 38.2% to 88.6% of the A-B move.
C-D Move:
An extension of 161.8% to 261.8% of the B-C move.
Completes at a 127.2% or 161.8% extension of the X-A move.
Identification
X-A Leg:
Identify the initial significant price movement.
A-B Leg:
Measure the retracement of the X-A leg, which should be 78.6%.
B-C Leg:
Measure the retracement of the A-B leg, which should be between 38.2% and 88.6%.
C-D Leg:
Measure the extension of the B-C leg, which should be between 161.8% and 261.8%.
Ensure the C-D leg also completes at a 127.2% or 161.8% extension of the X-A leg.
How to Trade the Butterfly Pattern
Entry Point:
Enter a trade at point D, where the pattern completes and a reversal is expected.
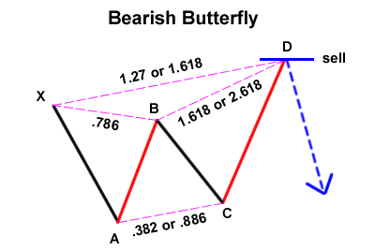
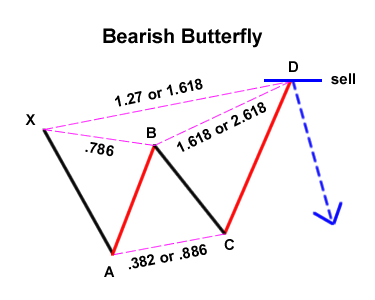
For a bullish Butterfly (X-A down), enter a long position.
For a bearish Butterfly (X-A up), enter a short position.
Stop-Loss Placement:
Place a stop-loss order beyond point D to manage risk.
This helps protect against the pattern failing and the price continuing in the same direction.
Profit Targets:
Set profit targets based on Fibonacci retracement levels of the C-D leg or previous significant highs/lows.
Common targets include the 38.2%, 50%, and 61.8% retracement levels of the C-D leg.
Example
Consider a bullish Butterfly pattern (expecting an upward reversal):
X-A Leg: Price moves down from $100 to $80.
A-B Leg: Price retraces up to $95 (78.6% retracement of X-A).
B-C Leg: Price retraces down to $85 (38.2% to 88.6% retracement of A-B).
C-D Leg: Price extends down to $70 (161.8% to 261.8% extension of B-C and 127.2% or 161.8% extension of X-A).
At point D ($70), the pattern completes, and a trader would look to enter a long position expecting a reversal.
Summary
The Butterfly Pattern is a harmonic pattern used to predict market reversals based on specific Fibonacci retracement and extension levels. By identifying the pattern's structure and following the key Fibonacci levels, traders can make informed decisions about potential entry and exit points in the market. This pattern helps in anticipating significant market reversals with a high degree of accuracy, making it a valuable tool for technical analysts.