Divergence trading
Divergence trading is a strategy used in technical analysis to identify potential changes in the direction of a financial asset's price trend. It involves comparing the price movements of an asset with an indicator, usually an oscillator like the Relative Strength Index (RSI), Moving Average Convergence Divergence (MACD), or the Stochastic Oscillator. Divergence trading seeks to identify discrepancies between the direction of the price and the direction of the indicator.
Divergence trading
Types of divergences:
Regular Divergence:
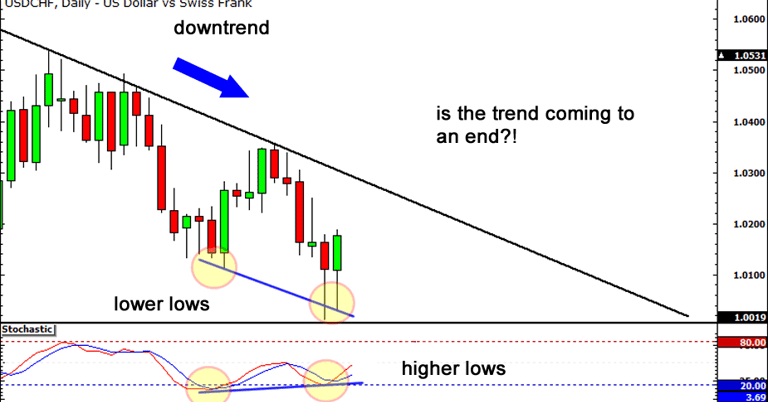
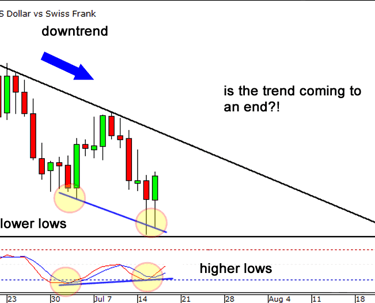
Bullish Divergence: Occurs when the price of an asset is making lower lows, but the indicator is making higher lows. This suggests that the downward momentum is weakening, and a price reversal to the upside may be imminent.
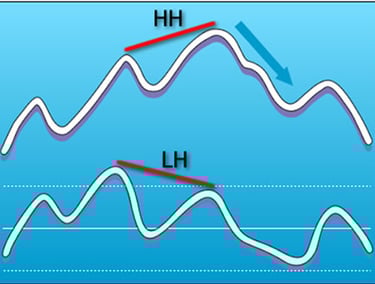
Bearish Divergence: Occurs when the price of an asset is making higher highs, but the indicator is making lower highs. This indicates that the upward momentum is weakening, and a price reversal to the downside may be imminent.
Hidden Divergence:
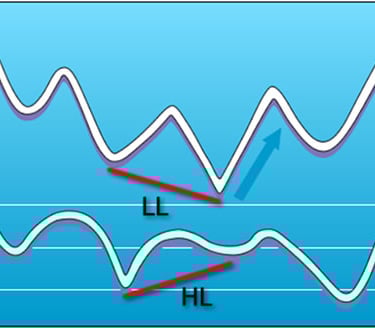
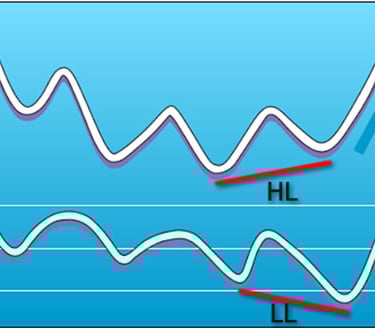
Bullish Hidden Divergence: Happens when the price makes higher lows, but the indicator makes lower lows. This often occurs during a retracement in an uptrend and suggests a continuation of the upward trend.
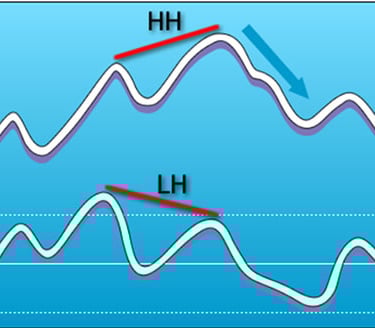
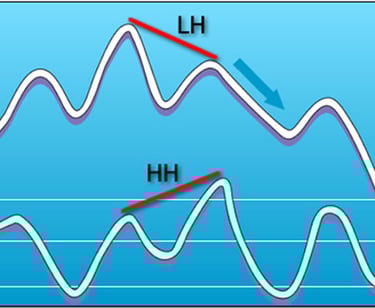
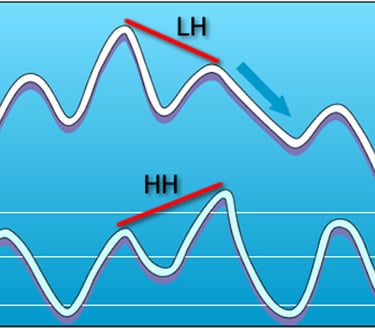
Bearish Hidden Divergence: Happens when the price makes lower highs, but the indicator makes higher highs. This typically occurs during a retracement in a downtrend and suggests a continuation of the downward trend.
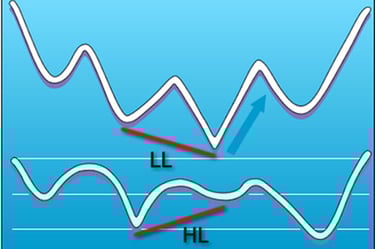
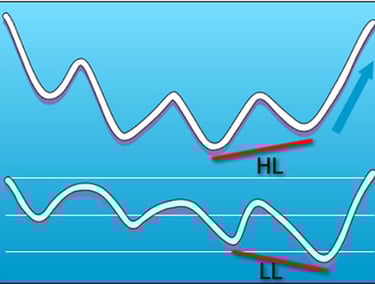
Regular Bullish Divergence
Regular Bearish Divergence
Hidden Bullish Divergence
Hidden Bearish Divergence
Key Points of Divergence Trading
Indicators Used: Common indicators for divergence trading include RSI, MACD, and Stochastic Oscillator.
Confirmation: Divergence should be used alongside other technical analysis tools and signals for confirmation. It is not a standalone strategy.
Time Frames: Divergence can be observed in various time frames, from intraday charts to daily or weekly charts, depending on the trader’s strategy.
Risk Management: Like all trading strategies, divergence trading requires proper risk management, including stop-loss orders and position sizing.
In summary, divergence trading is a technique that can help traders identify potential reversals or continuations in price trends by analyzing the relationship between price movements and technical indicators.