Breakout trading
Breakout trading is a strategy used in financial markets to capitalize on significant price movements that occur when the price of an asset breaks through a predefined level of support or resistance. This strategy aims to take advantage of increased volatility and potential trends that follow the breakout.
Breakout trading
Key Concepts
Support and Resistance Levels:
Support Level: A price level where an asset tends to find buying interest, preventing it from falling further.
Resistance Level: A price level where an asset tends to find selling interest, preventing it from rising further.
Breakout:
Occurs when the price moves above a resistance level or below a support level with increased volume.
Indicates potential continuation of the price movement in the direction of the breakout.
How to Trade Breakouts
Identify Key Levels:
Use technical analysis to identify strong support and resistance levels on the chart.
Wait for Confirmation:
Look for a price move that breaks the support or resistance level with a significant increase in trading volume.
This confirms the breakout and reduces the risk of a false breakout.
Enter the Trade:
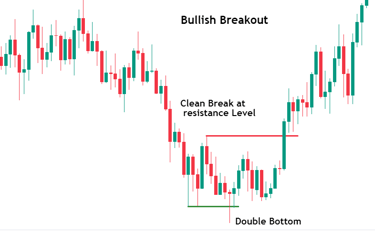
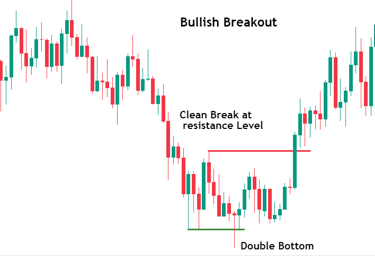
For a bullish breakout, enter a long position when the price breaks above the resistance level.
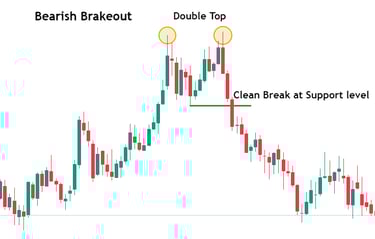
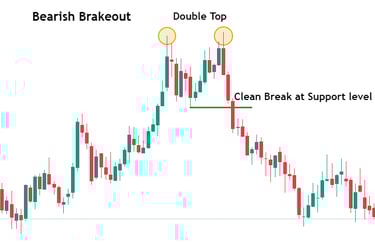
For a bearish breakout, enter a short position when the price breaks below the support level.
Set Stop-Loss Orders:
Place stop-loss orders below the resistance level for a bullish breakout or above the support level for a bearish breakout to manage risk.
This helps protect against the possibility of a false breakout.
Set Profit Targets:
Establish profit targets based on the size of the prior price range or use trailing stops to lock in profits as the price continues to move in the breakout direction
Types Of Breakout
Continuation breakouts
Reversal breakouts
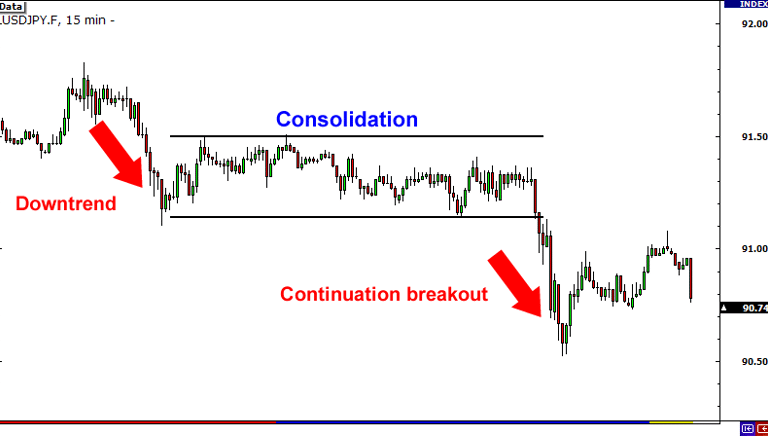
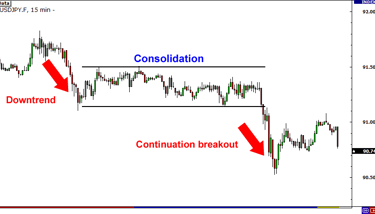
Continuation Breakouts
Continuation breakouts are a type of breakout in trading that occur within the context of an existing trend, signaling the potential continuation of that trend. These breakouts typically happen after a period of consolidation or a minor correction, during which the price moves sideways or slightly against the prevailing trend. When the price breaks out of this consolidation pattern in the direction of the original trend, it is considered a continuation breakout.
Key Characteristics of Continuation Breakouts
Existing Trend:
A continuation breakout follows an established trend, either upward (bullish) or downward (bearish).
Consolidation Phase:
Before the breakout, the price typically enters a consolidation phase, forming patterns such as flags, pennants, or rectangles. This phase represents a temporary pause in the trend.
Breakout Direction:
The breakout occurs in the direction of the prevailing trend. For an uptrend, this means breaking above the consolidation pattern's resistance. For a downtrend, it means breaking below the consolidation pattern's support.
Volume:
A significant increase in trading volume often accompanies continuation breakouts, providing confirmation that the breakout is likely to be sustained
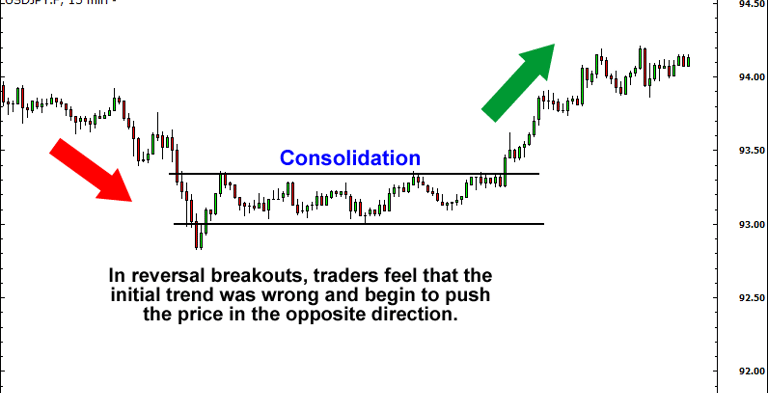
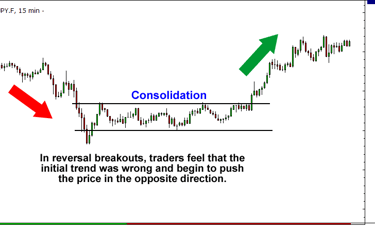
Reversal Breakouts
Reversal breakouts are a type of breakout in trading that signify a potential change in the direction of the prevailing trend. These breakouts occur when the price of an asset moves through a significant support or resistance level, indicating a shift from a bullish trend to a bearish trend, or vice versa. Reversal breakouts often follow the formation of specific chart patterns that signal a change in market sentiment.
Key Characteristics of Reversal Breakouts
Trend Reversal:
Reversal breakouts indicate a shift in the market trend. For example, a bullish trend reversing to a bearish trend, or a bearish trend reversing to a bullish trend.
Key Levels:
These breakouts occur at important support or resistance levels which, when breached, signal the change in trend direction.
Volume:
A significant increase in trading volume typically accompanies reversal breakouts, adding credibility to the breakout and the potential trend reversal
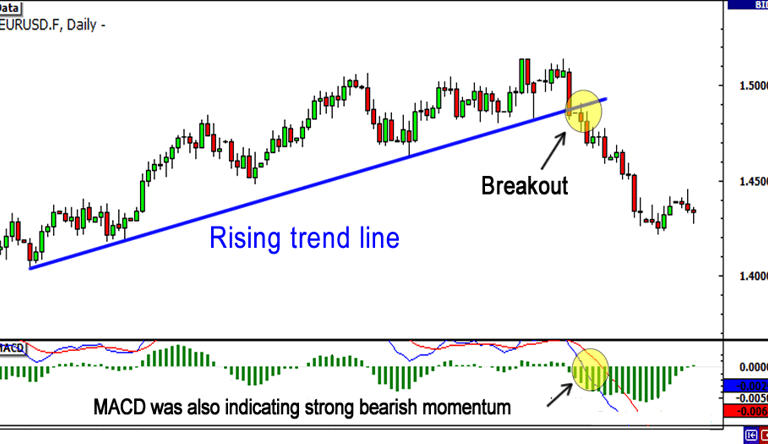
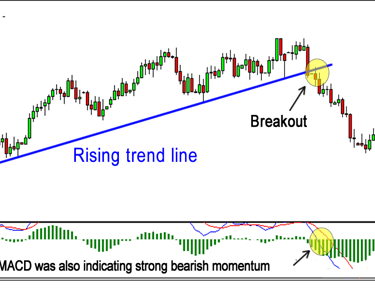
Trendline Breakout
Trading using trendline breakouts involves identifying key trendlines on a price chart and entering trades when the price breaks through these lines, signaling a potential change in trend direction or the continuation of the current trend.
Breakout trading using Trendlines and Channels
Here's a step-by-step guide on how to trade using trendline breakouts:
1. Identify the Trendline
Draw the Trendline:
Uptrend Line: Draw a line connecting at least two higher lows. This line acts as support.
Downtrend Line: Draw a line connecting at least two lower highs. This line acts as resistance.
2. Confirm the Trendline Validity
Ensure the trendline touches multiple points (at least three) to confirm its validity.
The more times the price touches the trendline without breaking it, the stronger the trendline.
3. Monitor for a Breakout
Uptrend Breakout: Watch for the price to break below the uptrend line, suggesting a potential reversal to the downside.
Downtrend Breakout: Watch for the price to break above the downtrend line, suggesting a potential reversal to the upside.
4. Confirm the Breakout
Volume Confirmation: Look for increased trading volume during the breakout, which indicates strong market interest and reduces the risk of a false breakout.
Candlestick Patterns: Look for strong candlestick patterns, such as engulfing patterns or large-bodied candles, to confirm the breakout.
5. Enter the Trade
Entry Point: Enter the trade immediately after the breakout is confirmed. You can also wait for a retest of the broken trendline, where the price moves back towards the trendline and then resumes in the breakout direction.
For a bullish breakout (above the downtrend line), enter a long position.
For a bearish breakout (below the uptrend line), enter a short position.
6. Set Stop-Loss Orders
Place a stop-loss order to manage risk:
For a long position, set the stop-loss just below the trendline or the most recent swing low.
For a short position, set the stop-loss just above the trendline or the most recent swing high.
7. Set Profit Targets
Determine profit targets based on technical levels such as previous support/resistance zones, Fibonacci retracement levels, or moving averages.
You can also use a risk-reward ratio to set your profit target (e.g., 2:1 or 3:1).
8. Manage the Trade
Trailing Stops: Use trailing stops to lock in profits as the price moves in your favor.
Monitor Key Levels: Keep an eye on key support and resistance levels that might impact the price movement.
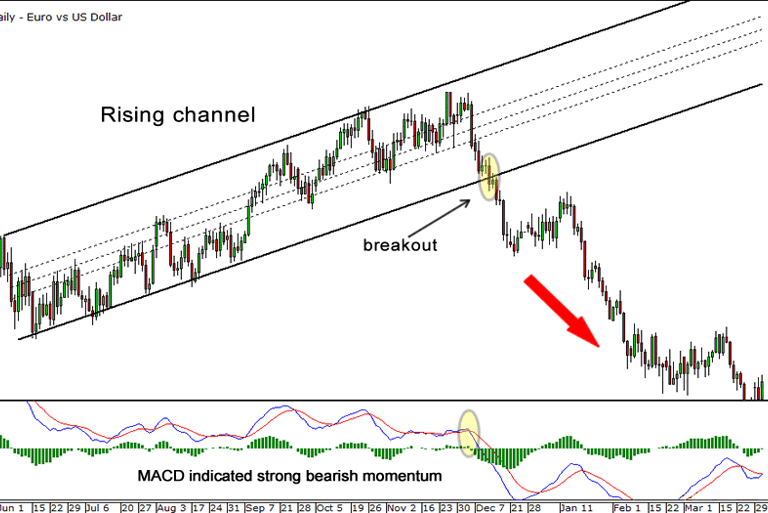
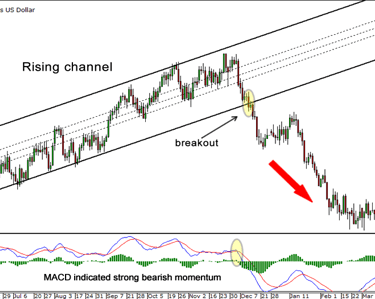
Channel Breakout
Trading using channel breakouts involves identifying price channels on a chart and entering trades when the price breaks out of these channels, indicating a potential change in trend direction or the continuation of the existing trend. Channels are formed by drawing parallel lines connecting the highs and lows of price movements, creating a bounded range within which the price oscillates.
Steps to Trade Using Channel Breakouts
1. Identify the Price Channel
Uptrend Channel: Formed by drawing two parallel lines that connect higher highs (resistance) and higher lows (support).
Downtrend Channel: Formed by drawing two parallel lines that connect lower highs (resistance) and lower lows (support).
Horizontal Channel: Formed by drawing two parallel lines that connect the horizontal highs (resistance) and lows (support).
2. Confirm the Channel
Ensure the price has touched both the upper and lower boundaries of the channel multiple times (at least three) to confirm its validity.
3. Monitor for a Breakout
Upper Boundary Breakout: Indicates a potential bullish move. Watch for the price to break above the upper boundary (resistance) of the channel.
Lower Boundary Breakout: Indicates a potential bearish move. Watch for the price to break below the lower boundary (support) of the channel.
4. Confirm the Breakout
Volume Confirmation: Look for a significant increase in trading volume during the breakout, which suggests strong market interest and reduces the risk of a false breakout.
Candlestick Patterns: Identify strong candlestick patterns, such as engulfing patterns or large-bodied candles, to confirm the breakout.
5. Enter the Trade
Bullish Breakout: Enter a long position when the price breaks above the upper boundary of the channel.
Bearish Breakout: Enter a short position when the price breaks below the lower boundary of the channel.
6. Set Stop-Loss Orders
Bullish Position: Set the stop-loss order just below the upper boundary of the channel or the most recent swing low.
Bearish Position: Set the stop-loss order just above the lower boundary of the channel or the most recent swing high.
7. Set Profit Targets
Determine profit targets based on technical levels such as previous support/resistance zones, Fibonacci retracement levels, or moving averages.
Alternatively, use a risk-reward ratio to set your profit target (e.g., 2:1 or 3:1).
8. Manage the Trade
Trailing Stops: Use trailing stops to lock in profits as the price moves in your favor.
Monitor Key Levels: Keep an eye on key support and resistance levels that might impact the price movement.
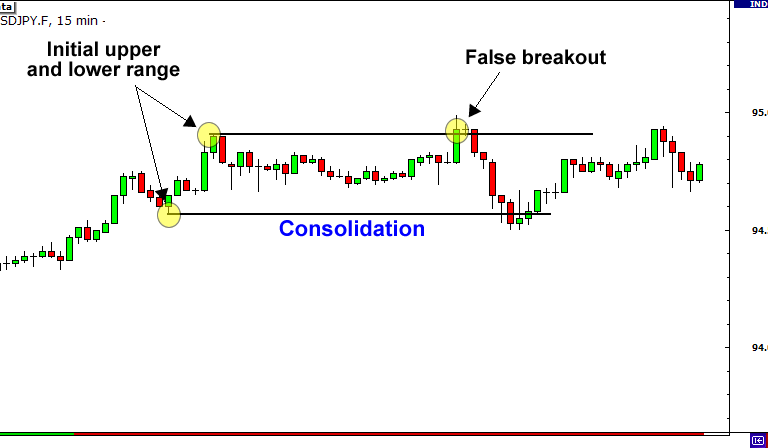
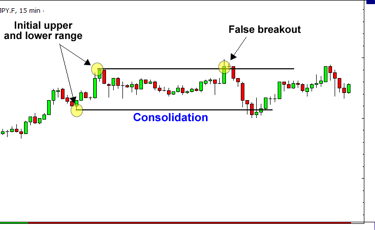
False Breakouts
False breakouts, also known as "fakeouts," occur when the price temporarily moves beyond a key support or resistance level but fails to sustain the movement, quickly reversing back within the previous trading range. These false signals can mislead traders into taking positions in the direction of the breakout, only to see the price reverse and move against them.
False Breakouts (Fake outs) & Fading
Key Characteristics of False Breakouts
Temporary Movement:
The price briefly breaks through a significant support or resistance level but does not continue in the breakout direction.
Quick Reversal:
After the initial breakout, the price quickly reverses direction and moves back into the prior trading range.
Volume Considerations:
False breakouts often occur with lower-than-expected volume. A lack of strong volume can indicate weak momentum behind the breakout, increasing the likelihood of a reversal.
Market Sentiment:
False breakouts can occur due to sudden changes in market sentiment, unexpected news, or manipulative activities by larger market participants (e.g., stop-loss hunting).
How to Identify False Breakouts
Lack of Volume Confirmation:
Genuine breakouts are typically accompanied by a significant increase in volume. A breakout with low or declining volume may signal a false breakout.
Failure to Sustain Beyond Key Levels:
If the price quickly returns to the previous trading range after breaking a key level, it is likely a false breakout.
Price Action and Candlestick Patterns:
Certain candlestick patterns, such as pin bars or engulfing candles, near key levels can indicate a potential false breakout.
Divergence with Indicators:
Divergence between price movement and technical indicators (e.g., RSI, MACD) can signal weakening momentum and a higher probability of a false breakout.
Strategies to Avoid False Breakouts
Wait for Confirmation:
Avoid entering a trade immediately after a breakout. Wait for a sustained move beyond the key level, ideally accompanied by increased volume.
Use Multiple Time Frames:
Analyze the breakout on multiple time frames to ensure it is not just a minor fluctuation on a shorter time frame.
Check for Confluence:
Look for confluence with other technical indicators or chart patterns that support the breakout direction.
Set Tight Stop-Loss Orders:
Place stop-loss orders close to the breakout level to minimize losses if the breakout turns out to be false.
Monitor News and Events:
Be aware of scheduled news events or economic reports that could cause sudden volatility and potential false breakouts.
Fading the breakouts
Fading the breakouts is a trading strategy that involves taking a position opposite to the direction of a breakout. This approach is based on the belief that many breakouts, especially those lacking strong momentum or volume, will fail and the price will revert back within the previous trading range. Traders who fade breakouts aim to profit from these false breakouts or temporary market overreactions.
Key Characteristics of Fading the Breakouts
Contrarian Approach:
Fading breakouts goes against the prevailing market sentiment at the time of the breakout. Instead of following the breakout, traders expect a reversal.
Volume and Momentum Analysis:
The strategy relies heavily on analyzing volume and momentum. Low volume or weak momentum during the breakout can signal a higher likelihood of a false breakout.
Risk Management:
Because this strategy goes against the immediate market movement, effective risk management through tight stop-loss orders is essential to limit potential losses.
Steps to Fade Breakouts
Identify Potential Breakout Levels:
Determine key support and resistance levels where breakouts might occur.
Wait for the Breakout:
Observe the price action as it approaches and breaks through these levels.
Analyze Volume and Momentum:
Assess whether the breakout is supported by strong volume and momentum. A breakout with low volume or weakening momentum may indicate a potential fade opportunity.
Look for Reversal Signals:
Monitor for reversal candlestick patterns (e.g., pin bars, engulfing patterns) or other technical indicators (e.g., RSI divergence) that suggest the breakout may fail.
Enter the Trade:
Bearish Fade: If the price breaks above a resistance level but shows signs of a reversal, enter a short position expecting the price to fall back below the resistance.
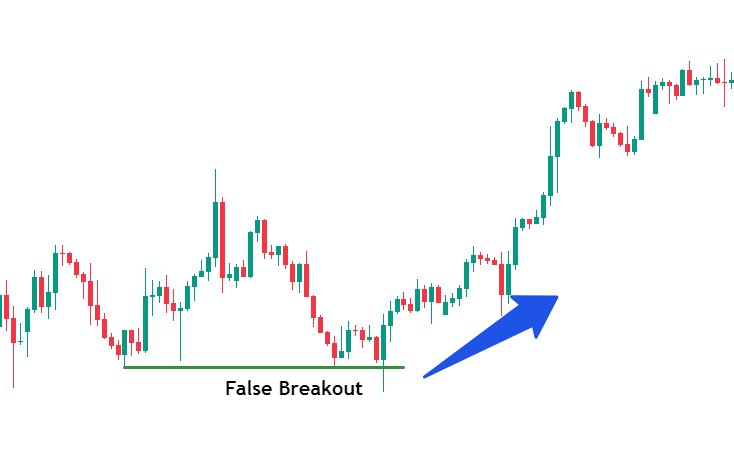
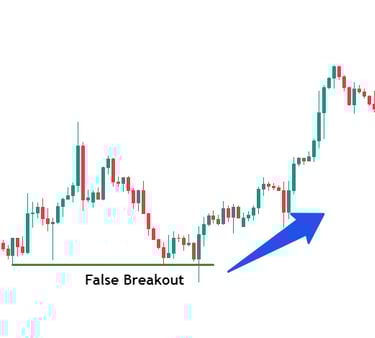
Bullish Fade: If the price breaks below a support level but shows signs of a reversal, enter a long position expecting the price to rise back above the support.
Set Stop-Loss Orders:
Place stop-loss orders just beyond the breakout level to manage risk. For a bearish fade, set the stop-loss above the resistance level. For a bullish fade, set the stop-loss below the support level.
Set Profit Targets:
Determine profit targets based on previous trading ranges or other technical levels where the price might find support or resistance again.