ICT Market Structure: BOS vs. MSS
Satheesh V
2/23/20253 min read
In ICT (Inner Circle Trader) Smart Money Concepts, understanding market structure is essential for identifying trend direction, liquidity grabs, and potential trade setups. Two of the most critical concepts within market structure are Break of Structure (BOS) and Market Structure Shift (MSS). These tools help traders differentiate between trend continuation and trend reversals, providing a strong foundation for smart money trading strategies.
What is Market Structure in ICT?
Market structure in ICT refers to the overall price movement that determines whether the market is in a bullish, bearish, or consolidating state. It is classified into three types:
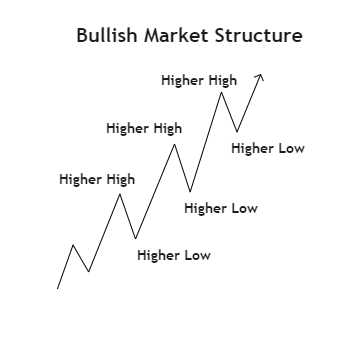
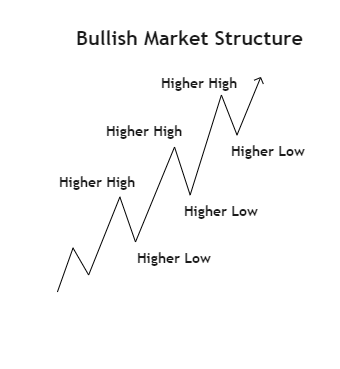
Bullish Market Structure
Price forms higher highs (HH) and higher lows (HL).
This indicates an uptrend, where smart money is accumulating long positions.
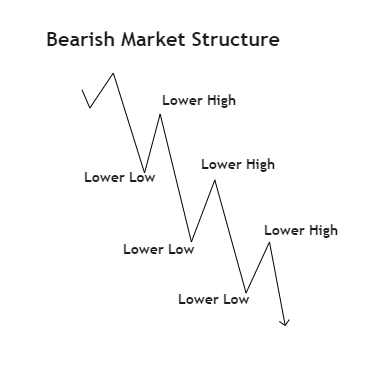
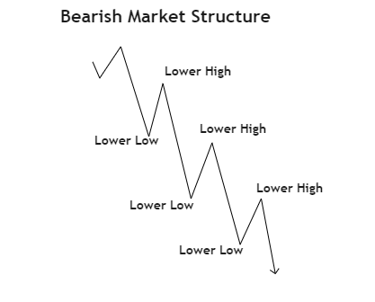
Bearish Market Structure
Price forms lower highs (LH) and lower lows (LL).
This signals a downtrend, where smart money is distributing and entering short positions.
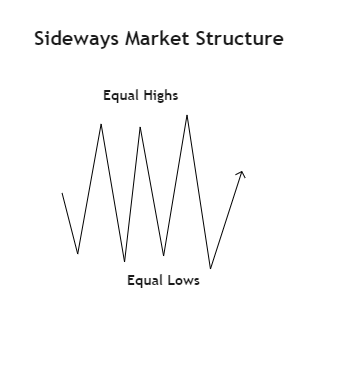
Sideways/Consolidating Market
Price moves in a range without clear HH or LL.
It often precedes a breakout, driven by liquidity grabs and institutional order flow.
Why Market Structure Matters?
Market structure helps traders:
Identify the dominant trend.
Spot potential entry and exit points.
Understand liquidity sweeps and institutional footprints.
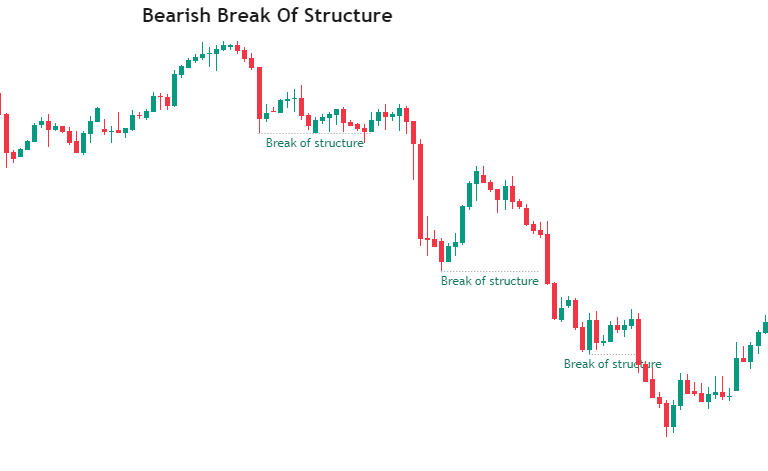
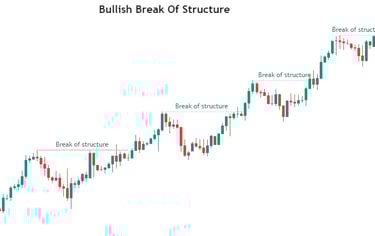
Break of Structure (BOS) – Trend Continuation
A Break of Structure (BOS) occurs when price breaks a key high (in an uptrend) or a key low (in a downtrend), confirming the continuation of the prevailing trend.
Types of BOS:
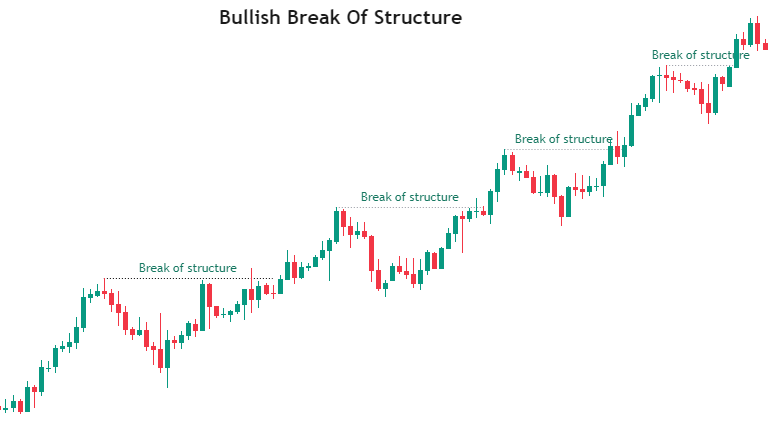
Bullish BOS
Price breaks a previous swing high.
Confirms an uptrend with HH and HL formations.
Traders wait for a retracement to fair value gaps (FVGs) or order blocks (OBs) to enter long trades.
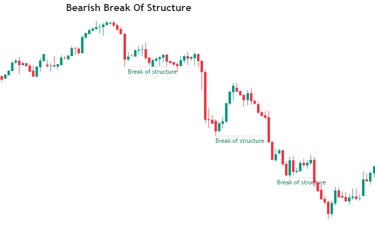
Bearish BOS
Price breaks a previous swing low.
Confirms a downtrend with LL and LH formations.
Traders wait for a retracement to an order block or FVG before shorting.
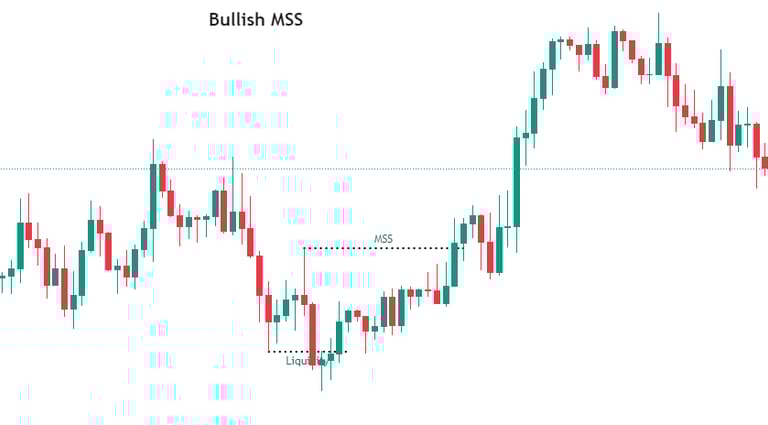
Market Structure Shift (MSS) – Trend Reversal
A Market Structure Shift (MSS) occurs when price aggressively breaks a key level after a liquidity grab, signaling a potential trend reversal. Unlike BOS, which confirms continuation, MSS hints at a change in direction.
How to Identify MSS?
Bullish MSS
Price sweeps a previous low (taking sell-side liquidity).
Then, price aggressively breaks a key high.
This shift suggests a reversal to bullish sentiment.
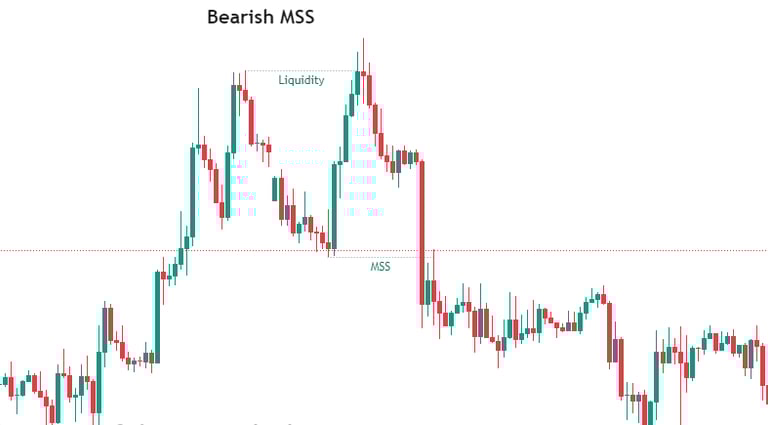
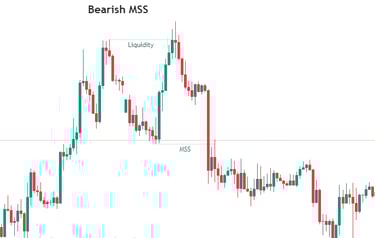
Bearish MSS
Price sweeps a previous high (taking buy-side liquidity).
Then, price aggressively breaks a key low.
This shift suggests a reversal to bearish sentiment.
How to Use BOS and MSS in Trading?
For Trend Traders (Using BOS):
Identify a clear uptrend or downtrend.
Look for BOS to confirm trend continuation.
Enter on pullbacks at FVGs, order blocks, or discounted price levels.
For Reversal Traders (Using MSS):
Spot liquidity sweeps (stop hunts at major highs/lows).
Wait for MSS confirmation before entering trades.
Target the next liquidity pool for profit-taking.
Final Thoughts
Understanding Market Structure, BOS, and MSS is crucial for trading ICT Smart Money Concepts. BOS helps traders follow the trend, while MSS signals when the trend is shifting. By combining these concepts with liquidity analysis, traders can develop a high-probability strategy aligned with institutional order flow.
Key Takeaways:
Market structure defines the trend (bullish, bearish, or range-bound).
BOS confirms trend continuation and provides re-entry opportunities.
MSS signals trend reversal after liquidity sweeps.
Combine BOS and MSS with liquidity grabs, order blocks, and fair value gaps for high-probability trades.
By mastering these concepts, traders can refine their strategy, improve risk management, and trade in alignment with Smart Money movements..
Key Takeaway: MSS typically happens after a liquidity grab and suggests a high-probability reversal.
Key Takeaway: BOS indicates trend continuation, meaning the market is likely to sustain its current direction.