Candle Range Theory (CRT) – An ICT-Inspired Trading Approach
Satheesh V
2/16/20254 min read
Mastering the Candle Range Theory (CRT) – An ICT-Inspired Trading Approach
Hey traders! Today, we dive deep into a fascinating and viral trading concept—Candle Range Theory (CRT). While CRT is not directly part of the official ICT (Inner Circle Trader) methodology, it draws heavily from core ICT principles like Liquidity Sweeps, Power of 3 (PO3), and Session High/Low Liquidity. This post breaks down CRT and how you can incorporate it into your trading strategy for better precision and higher profitability.
Understanding the Candle Range
To grasp CRT effectively, you need a basic understanding of candlesticks:
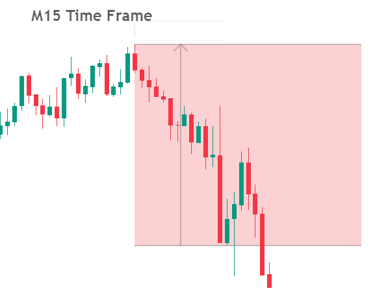
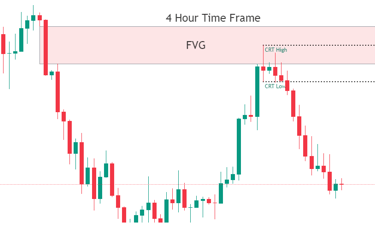
Each candlestick on a higher timeframe (HTF) reflects a range on lower timeframes (LTF).
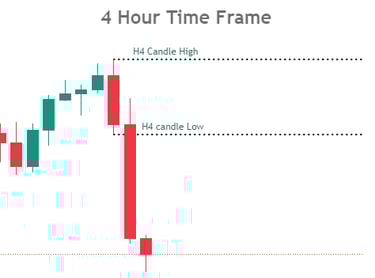
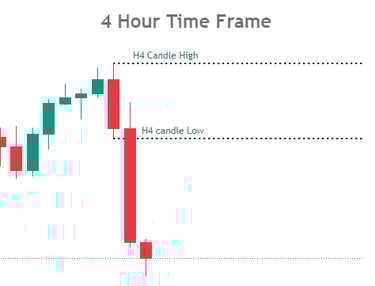
CRT-High: The high of a candlestick on a HTF, representing the upper boundary of the range on LTF.
CRT-Low: The low of a candlestick on a HTF, marking the lower boundary of the range on LTF.
This concept aligns with ICT teachings where higher timeframe levels hold key liquidity zones that are often targeted during price movements.
What Is Candle Range Theory (CRT)?
The Candle Range Theory revolves around liquidity raids—a key ICT principle. In essence, the theory suggests that price tends to raid liquidity from the previous candle’s range before moving toward the next liquidity level.
Bullish CRT: If price grabs the CRT-Low, it may target the CRT-High.
Bearish CRT: If price raids the CRT-High, it may aim for the CRT-Low.
This theory allows traders to anticipate price movements after liquidity sweeps and capitalize on the subsequent directional move.

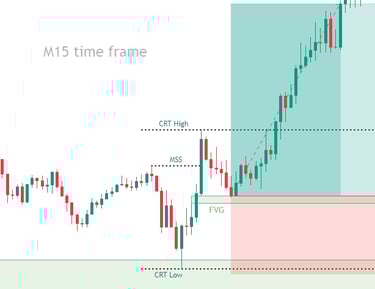
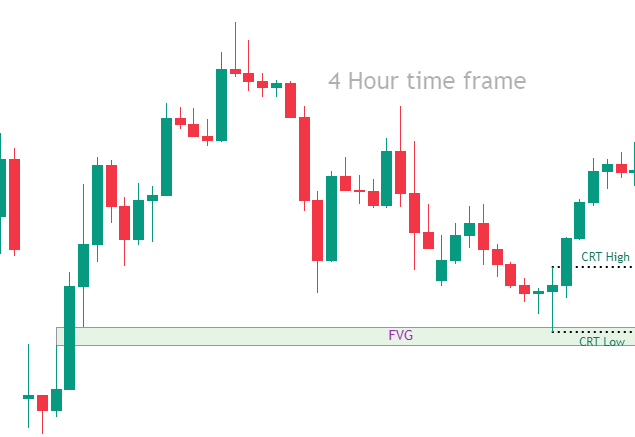
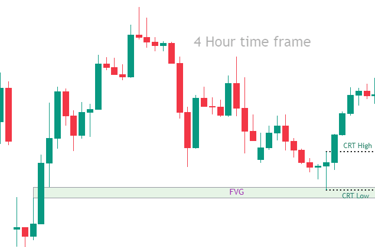
The Bullish CRT Model
When the price is near a key support level on a higher timeframe, the bullish CRT model comes into play.
Step-by-Step Guide to a Bullish CRT Model:
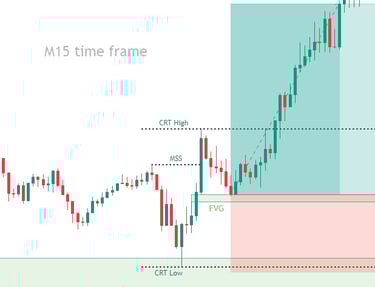
Mark the CRT-High and CRT-Low: Identify the high and low of the candlestick at the key support zone.
Wait for Liquidity Grab: Observe the next candlestick—it should raid the low of the previous candle and close above that low.
Confirmation: Wait for a subsequent candlestick to close above the high of the liquidity-raiding candle.
Alternatively, you can:
Look for an ICT Market Structure Shift (MSS) on a lower timeframe.
Enter a buy trade on the retest of the MSS zone.
Risk Management:
Stop-Loss: Below the low of the liquidity-raiding candle or the MSS-low.
Take-Profit: CRT-High or the next major liquidity level.
Pro Tip: This setup can unfold within three candlesticks, but sometimes price may accumulate, requiring patience for a proper breakout.
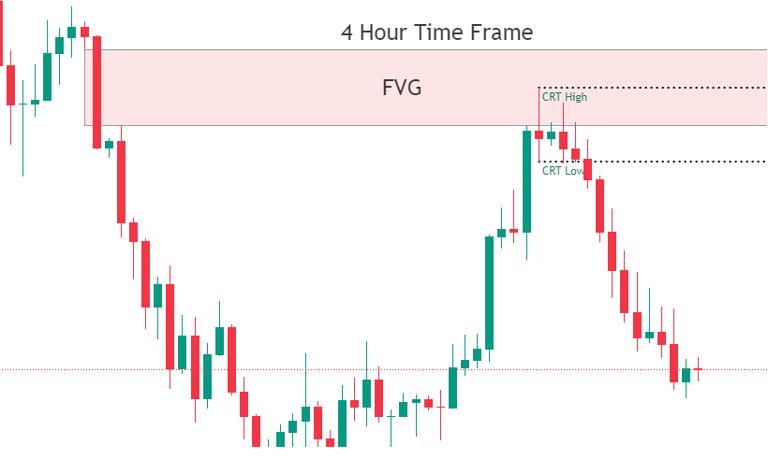
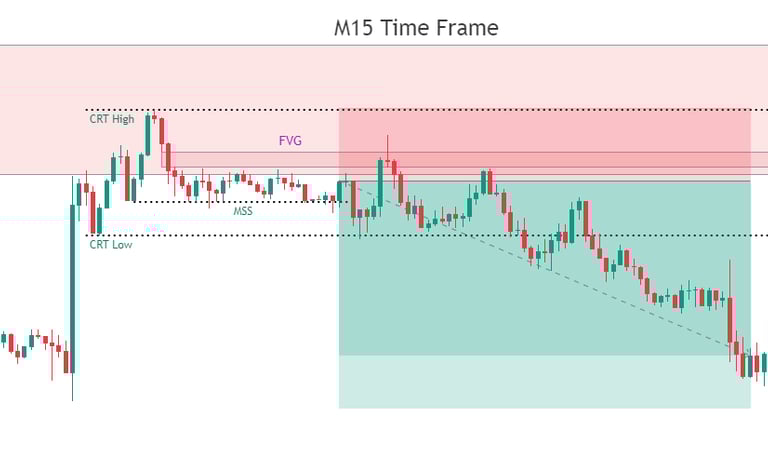
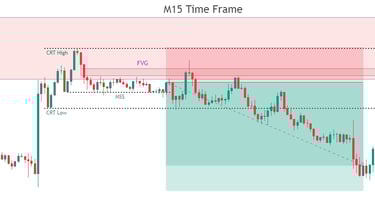
The Bearish CRT Model
When the price approaches a key resistance level on a higher timeframe, the bearish CRT model becomes relevant.
Step-by-Step Guide to a Bearish CRT Model:
Mark the CRT-High and CRT-Low: Identify the high and low of the candlestick at the key resistance level.
Wait for Liquidity Grab: Allow the next candlestick to raid the high of the previous candle and close below it.
Confirmation: Wait for another candlestick to close below the low of the liquidity-raiding candle.
Alternatively, you can:
Look for an ICT Market Structure Shift (MSS) on a lower timeframe.
Enter a sell trade on the retest of the MSS zone.
Risk Management:
Stop-Loss: Above the high of the liquidity-raiding candle or the MSS-high.
Take-Profit: CRT-Low or the next liquidity level.
Identifying High-Probability CRT Setups
The most reliable CRT setups typically occur during ICT Kill Zones or ICT Session Raids—periods of heightened liquidity and volatility.
London Open: Look for CRT models as liquidity is swept during the London session.
New York Open: Prime time for CRT setups as institutional movements trigger liquidity grabs.
ICT Power of 3 (PO3) vs. Candle Range Theory (CRT)
While CRT and ICT PO3 are closely related, they focus on different structural aspects:
ICT PO3: Price undergoes three phases—Accumulation, Manipulation, and Distribution. Liquidity is taken in one direction before reversing.
CRT: Focuses on raiding the CRT-High/Low and then moving toward the opposite liquidity level.
In practice, CRT-High/Low can align with ICT’s Previous Day High/Low or Session High/Low, offering greater confluence for trades.
Conclusion
The Candle Range Theory (CRT) is not a new strategy—it is an extension of ICT principles focusing on liquidity dynamics. By mastering CRT, you gain a deeper understanding of liquidity raids and price targets, allowing you to:
✅ Identify high-probability trades during ICT Kill Zones.
✅ Enhance trade confirmation through liquidity sweeps and MSS.
✅ Improve risk management by aligning stop-losses with liquidity levels.
Incorporate CRT into your trading arsenal and watch your market precision grow. Remember—price moves for a reason, and liquidity is the key driver.
Happy Trading!